
Introduction
USDT Dominance (USDT.D) is a powerful metric in understanding investor sentiment within the crypto market. A rising USDT.D suggests market participants are moving into stablecoins like Tether for safety, often during market downturns. Conversely, a declining USDT.D indicates capital is flowing out of stablecoins and into riskier crypto assets, often signaling a bullish trend in the broader market.
The current chart of USDT.D on the daily timeframe is painting a compelling bearish picture, hinting at a potential shift toward renewed optimism and upward momentum in the cryptocurrency sector.
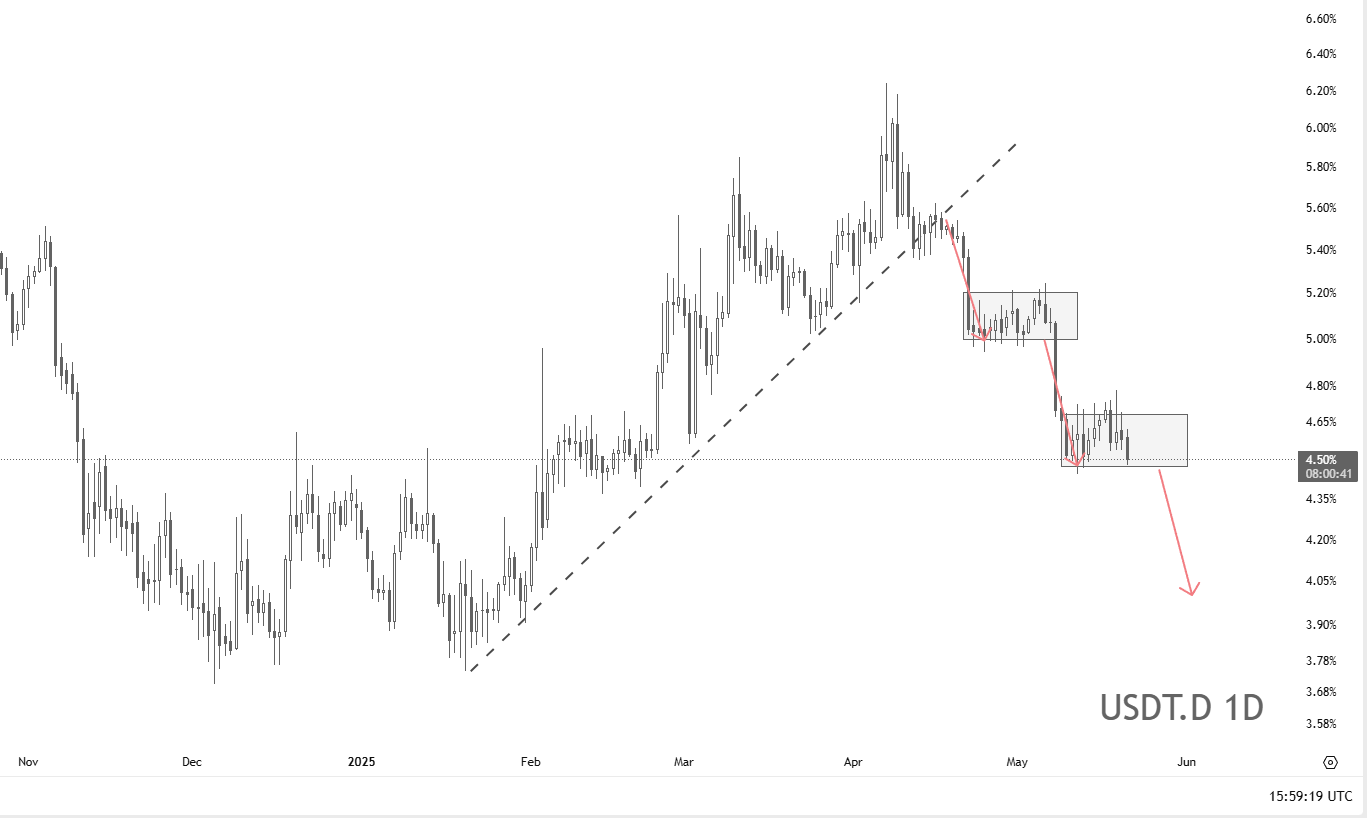
Chart Overview
- Trend Reversal Confirmed:
The chart displays a clean ascending trend that persisted from early 2025 until late April. This uptrend was decisively broken, signaling the start of a bearish phase for USDT.D. - Bearish Market Structure:
After breaking the ascending trendline, USDT.D formed two consecutive bearish consolidation patterns (rectangles), both followed by sharp declines. These structures resemble a classic bearish flag or distribution zone, typically found in downtrends. - Lower Highs and Lower Lows:
The asset is consistently forming lower highs and lower lows — a textbook downtrend. The most recent price action shows a failed attempt to break above the current resistance zone (~4.65%), indicating continued bearish pressure.
Key Technical Levels
- Resistance Zones:
- 4.80% – 4.65%: Upper boundary of current consolidation.
- 5.20%: Prior distribution zone, now a strong resistance.
- Support Levels:
- Immediate support: 4.35% (bottom of the current range).
- Next major target: 4.00% – psychological support and previous consolidation zone.
- Extended target: 3.85% – a level last seen during bullish crypto market phases.
Forecast and Implications
Short-Term Outlook:
USDT.D is likely to break below the current consolidation range. If the 4.35% level gives way, expect a sharp move toward the 4.00% psychological support. The chart's price action, combined with the strong rejection at upper resistance, supports this view.
Medium to Long-Term Outlook:
A continued decline in USDT dominance could signal the onset of an altcoin season, where capital flows from stablecoins into more volatile assets such as Bitcoin and Ethereum, followed by altcoins. This would likely coincide with a broader market rally.
Conclusion
The daily chart of USDT.D is signaling a bearish continuation pattern, pointing toward further downside. A break below 4.35% would confirm the next leg down, targeting the 4.00%–3.85% range. This decline in Tether dominance could mark the beginning of renewed bullish momentum in the cryptocurrency markets.
Traders and investors should watch for confirmation of the breakdown and monitor capital rotation into risk assets — a strong indication that market sentiment is shifting back to risk-on mode.
Comments
Leave a Comment