
3 Minutes
Bitcoin Breaks Key Level, Fueling Optimism for Major Upside
Bitcoin is once again capturing the attention of the crypto community after reclaiming a vital technical milestone. Market observers note that the leading cryptocurrency's ascent past a pivotal moving average could signal the start of a new bullish phase.
Rally Driven by 50-Day EMA Reclaim
According to a June 25 analysis from CryptoQuant contributor İbrahim COŞAR, Bitcoin recently surged above its 50-day exponential moving average (EMA)—a key indicator frequently used by traders to gauge trends and momentum shifts in the crypto market. This crucial recovery is noteworthy; historically, whenever Bitcoin has dipped below the 50-day EMA during sharp corrections and subsequently rebounded, its price often jumped by 10% to 20% in the short term.
Currently, Bitcoin has recorded three consecutive daily closes above this technical threshold, suggesting renewed control by bullish investors. COŞAR believes this pattern could open the door to a rapid move towards the much-anticipated $120,000 price target.
Geopolitical Volatility Looms Over Price Action
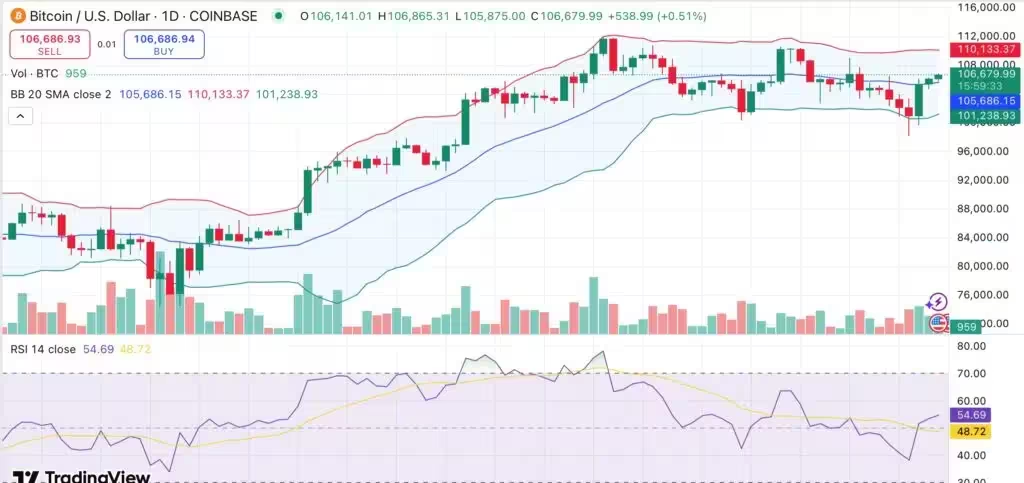
Despite the optimism, COŞAR warns that ongoing geopolitical tensions—especially involving the United States, Israel, and Iran—could inject heightened volatility into the cryptocurrency market. These developments have already influenced recent price swings. At the time of writing, Bitcoin trades at $106,720, marking a 1.4% increase over the past 24 hours and recovering 7.8% from the June 22 low of $98,974, which was triggered by escalating Middle East tensions.
Spot Bitcoin ETFs See Robust Inflows
Investor confidence in Bitcoin remains resilient despite the turbulent global backdrop. Spot Bitcoin exchange-traded funds (ETFs) have recorded net inflows for eleven straight days, underscoring robust institutional and retail demand. SoSoValue data shows that total net capital inflows exceeded $938 million over the past week, reinforcing Bitcoin's appeal as a hedge against inflation and geopolitical uncertainty.
Technical Indicators Point to Growing Bullishness
Technical analysis reveals that Bitcoin is approaching resistance near the $110,100 mark after breaking above the 50-day EMA. Sustained consolidation above the $105,700–$106,000 range would further validate bullish momentum. Meanwhile, the relative strength index (RSI) registers 54.69, signaling positive momentum without entering overbought territory. Short-term moving averages emit a "buy" signal, and the moving average convergence divergence (MACD) indicator has also flipped bullish.
For upward momentum to continue, bulls must push Bitcoin above the $108,000–$110,000 resistance zone. Achieving a daily close above $110,000 could pave the way for a test of the $114,000–$120,000 range. Should momentum weaken, key support is seen at $105,000, while larger pullbacks could find buyers around $102,000 or even $98,900.

Comments