5 Minutes
The Foundation of Technical Analysis in Financial Markets
Technical analysis remains one of the most popular methods for making trading decisions in global financial markets — from traditional stocks and forex to the fast-paced world of cryptocurrencies. Traders rely on a wide range of technical tools, from classic price patterns and chart formations to technical indicators and trendlines. But the key question persists: do these technical analysis tools genuinely offer an edge, or are they merely widely repeated myths that fail under real-market conditions? In this comprehensive, data-driven report, we critically examine the effectiveness of technical analysis patterns, with a special focus on their use in the crypto market.
A Brief History: Why Technical Analysis Matters
The roots of technical analysis stretch back to the 19th century and the pioneering work of Charles Dow. The basic premise is simple yet profound: ‘Everything is reflected in the price.’ Technical analysts believe that all market-impacting information — whether economic, political, or psychological — is ultimately embedded in price movements. Their toolkit covers candlestick patterns, chart shapes, support and resistance levels, as well as widely-used indicators such as the Moving Average (MA), Moving Average Convergence Divergence (MACD), and Relative Strength Index (RSI).
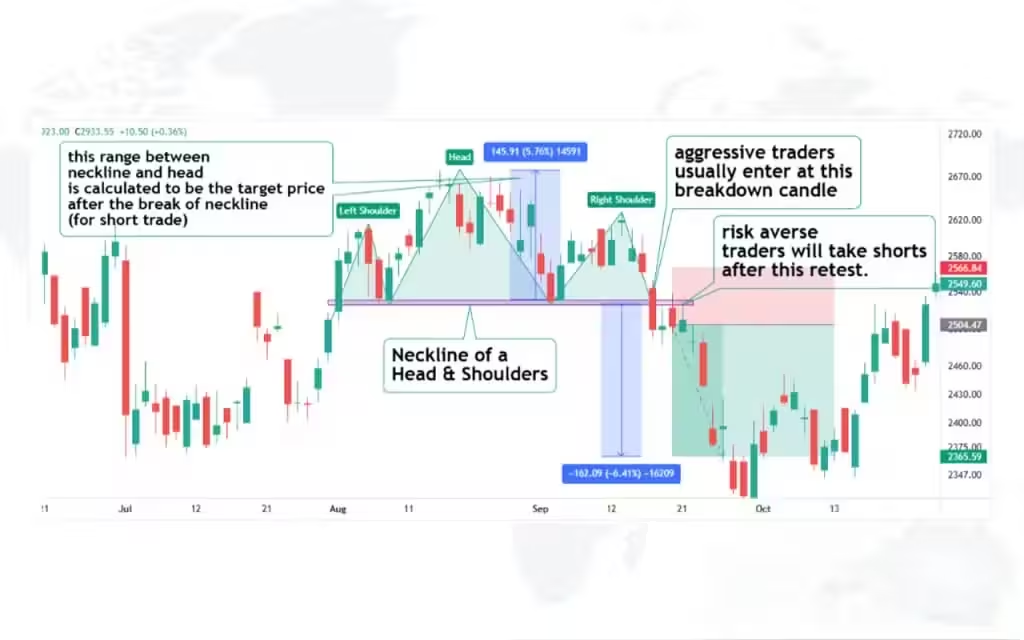
Do Classic Chart Patterns Like “Head and Shoulders” Actually Work?
According to data collected by WallStreetZen, classic chart patterns such as the ‘Head and Shoulders,’ ‘Flags,’ ‘Triangles,’ and ‘Double Top’ remain some of the most frequently used strategies in technical trading. The ‘Head and Shoulders’ pattern, for instance, has reportedly predicted price direction correctly over 90% of the time in certain studies. Another extensive research project featured on Strike.money analyzed 42 different technical patterns, finding that several demonstrated a success rate between 65% and 80% — but only when deployed under the right circumstances and confirmed with additional technical indicators.
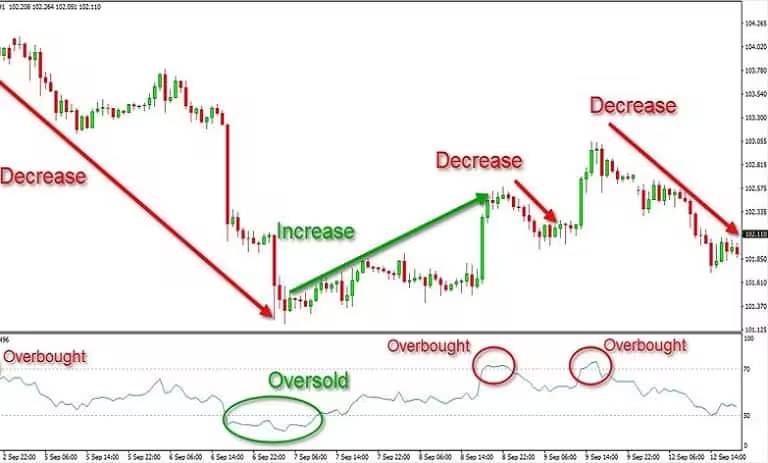
The Role of Technical Indicators in Boosting Accuracy
Most skilled traders do not rely solely on chart patterns. Instead, they frequently combine candlestick formations with technical indicators like RSI and MACD for a deeper understanding of market momentum and potential reversals. For example, a negative divergence between price action and the MACD indicator may signal a weakening bullish trend. According to Investopedia, integrating candlestick analysis with indicators such as RSI or moving averages can significantly improve the chances of making accurate market predictions.
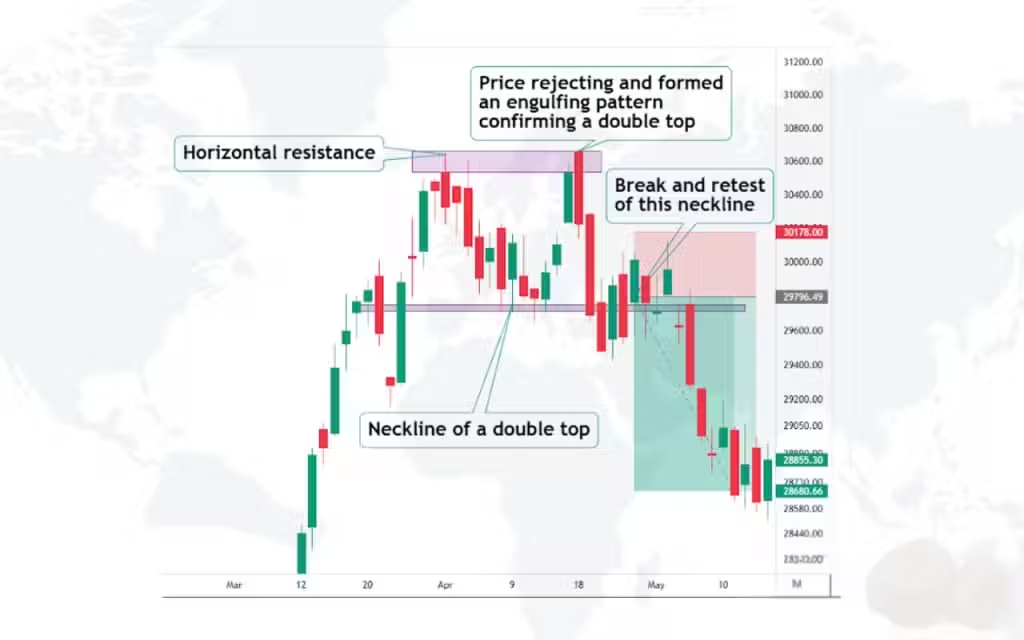
Market Psychology Reflected in Technical Patterns
Beneath the surface, technical analysis is much more than a system of lines and geometric shapes. It is, at its core, a visual representation of trader psychology and collective market behavior. Consider the ‘Double Top’ pattern: it often emerges when buyers become cautious after a price rally and the asset fails to break resistance — reflecting hesitation and shifting sentiment in real time. Many technical patterns therefore serve as a direct manifestation of market psychology. This is also why even fundamental analysts often use technical tools for trade timing and risk management.
What Do the Numbers Show? Real-World Efficacy of Technical Patterns
Data speaks volumes about the true effectiveness of technical patterns in trading. A major study published on Medium evaluated 136,555 trades that were based on candlestick patterns. Astonishingly, only 7,247 trades — about 5.3% — achieved a statistically significant ability to predict price movement. However, the same study also highlighted that certain patterns like ‘Bullish Engulfing’ or ‘Hammer’ performed better in specific contexts, such as near strong support levels and when supported by RSI confirmation.
Technical Analysis in the Volatile Cryptocurrency Market
The cryptocurrency market is renowned for its extreme volatility, the presence of large investors (so-called ‘whales’), and a general lack of traditional fundamental data — making it one of the sectors where technical analysis is most widely applied. Crypto traders in Bitcoin (BTC), Ethereum (ETH), and various altcoins often look to technical analysis patterns to identify optimal entry and exit points. Nonetheless, sustained profitability in crypto trading typically depends on combining technical analysis with solid risk management, monitoring market news, and considering trading volume.
Criticisms: Skepticism Toward Technical Analysis
Despite its popularity, technical analysis faces criticism from some professional economists, who dismiss it as ‘financial astrology.’ Skeptics argue that, since charts reflect past price action, they cannot reliably predict the future. They also warn of confirmation bias — the human tendency to ‘see’ patterns that simply aren’t there. However, technical analysts often counter this by clarifying that their goal is not perfect prediction, but rather identifying higher-probability opportunities and improving risk/reward ratios.
Conclusion: Is Technical Analysis a Science or an Art?
In summary, while technical analysis has its share of critics, millions of traders worldwide — across equities, forex, and especially crypto — continue to trust its insights and strategies. Technical patterns and indicators serve as a common language for market participants. The verdict? Candlestick and chart patterns alone are rarely sufficient. For best results, they should be used alongside other tools, in the right market context, and with strong confirmations. Ultimately, technical analysis is as much an art as a science: a dynamic skill for reading market psychology and making informed trading decisions in the digital asset ecosystem.
Comments