
4 Minutes
Solana tumbles to a 52‑week low as market-wide sell-off intensifies
Solana (SOL) plunged to a 52-week low after a fresh wave of liquidations and risk-off sentiment swept across crypto markets. SOL briefly touched $66.6 and was trading near $68 on June 4, marking a roughly 27% decline over the past month and nearly 74% slide from its 2025 high near $258. The sell-off coincided with large derivatives liquidations and the first net outflow day for U.S. spot Solana ETFs since May.
Key market moves and figures
- Solana hit a 52-week low of $66.6; intraday trading saw prices near $68.
- Crypto derivatives liquidations exceeded $1.66 billion in 24 hours, with about $1.42 billion coming from long positions.
- U.S. spot Solana ETFs reported $12.7 million in net outflows on June 3, ending a period of steady inflows.
Derivatives and liquidations drive immediate pressure
The rapid price decline was amplified by a cascade of leveraged liquidations as Bitcoin weakened and broader risk appetite faltered. Data from CoinGlass shows more than $1.66 billion wiped from crypto derivatives markets in 24 hours; the bulk of that pain hit long traders, who were forced to close positions at market prices and add selling momentum across major altcoins, including SOL.
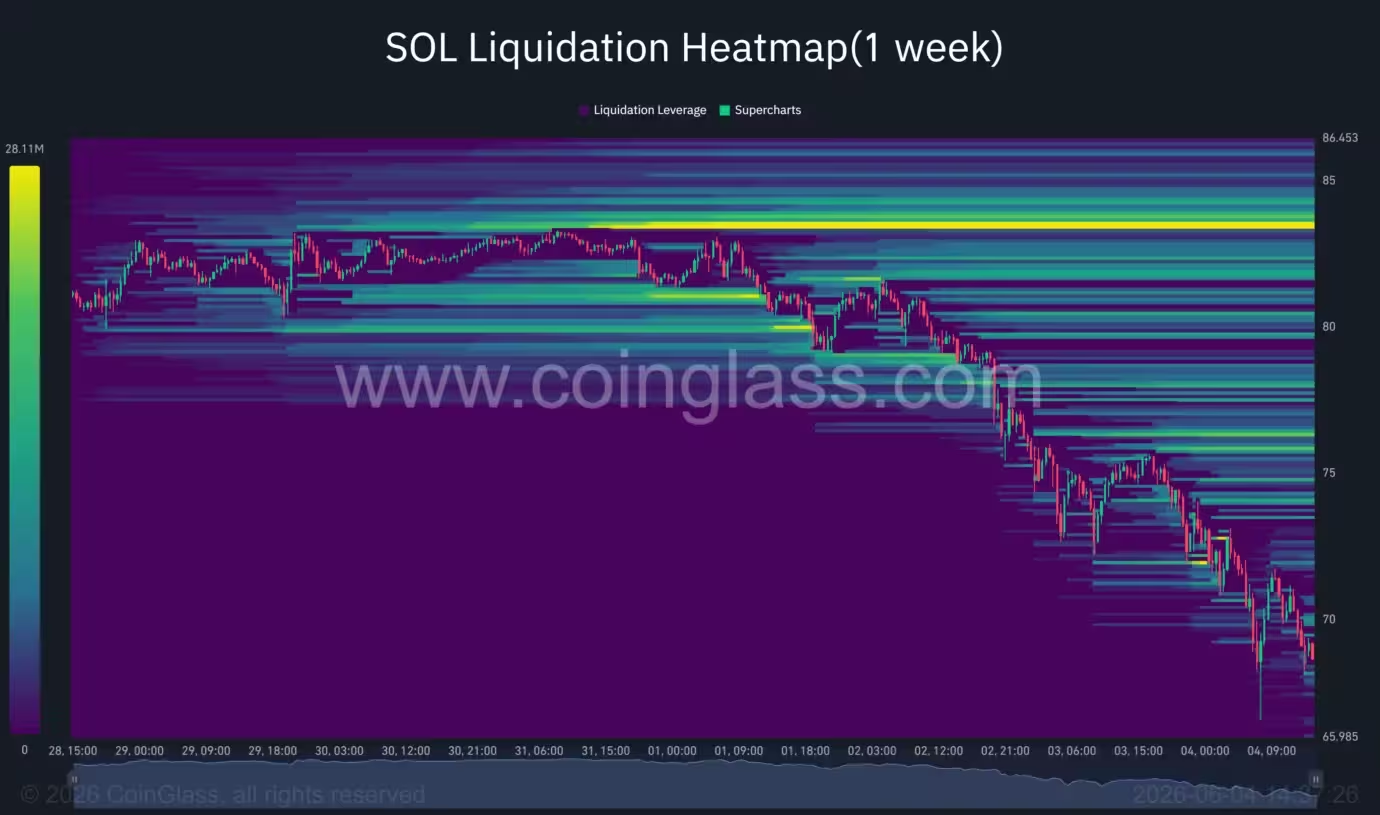
Solana liquidation heatmap
Institutional flows and macro factors deepen the downturn
Institutional interest in Solana cooled this week as U.S. spot SOL ETFs recorded their first net redemptions since May. The $12.7 million outflow on June 3 indicates investors trimmed exposure to higher-beta crypto assets amid rising macro and geopolitical uncertainty.
Outside the crypto sphere, renewed geopolitical tensions in the Middle East and a pickup in crude oil prices encouraged a shift toward traditional safe havens. At the same time, markets are pricing in the possibility that central banks keep policy restrictive for longer, creating a tougher backdrop for speculative assets.
Technical breakdown confirms bearish bias
On the weekly chart, Solana has decisively broken below the $76.6 support zone that capped declines for months. Sellers pushed prices beneath the psychological $70 mark and drove SOL to the $66.6 area, which now stands as the closest near-term support.

Solana price has lost a critical support level on the weekly chart — June 4
Technical indicators have deteriorated: SOL is trading below the Supertrend (around $114), well under key moving averages that acted as support in 2025. The weekly MACD remains below zero and both MACD lines are trending lower, signaling persistent downside momentum. Until these momentum indicators stabilize or reverse, sellers retain control of the broader trend.
A one-week liquidation heatmap from CoinGlass identifies a concentration of leveraged positions between $82 and $84. If a relief rally emerges, that cluster could attract price — but it would also act as a notable resistance zone following the recent breakdown.
Analyst outlook and potential scenarios
Some market commentators expect further downside before a sustained recovery. Analyst Jack Adams warned that SOL could retest lower levels: "I am almost certain $SOL is heading back to retest $67-$58 once more before reversing into $120-$175 this year." That view rests on historical rejection zones and the idea that longer-term buyers may step in near the upper-$50s.
Two primary paths now define near-term risk:
- Bear case: If $66 support fails decisively, the next meaningful historical buffer is the upper-$50 region. Continued large-scale ETF redemptions or another round of long liquidations — particularly if Bitcoin slips below nearby support — could accelerate downward momentum.
- Bull case: For a credible recovery, Solana must reclaim the former $76.6 support and push through the $82–$84 liquidity cluster where short-covering and stalled long positions could create upward pressure. Stabilization in ETF flows and fewer derivatives liquidations would also be necessary to restore confidence.
Trading implications and risk management
Traders should closely monitor ETF flows, open interest in SOL derivatives, and Bitcoin’s price action. Given the current technical structure, traders who remain active may prefer tighter risk controls, smaller position sizes, and defined stop levels until clear signs of momentum reversal appear. Long-term investors assessing accumulation points may watch the upper-$50 area highlighted by technicians as a potential buy zone, though that strategy assumes markets remain receptive to risk over coming months.
Conclusion
Solana’s plunge to a 52-week low underscores how quickly leveraged positioning and institutional flows can amplify price moves in crypto markets. Until SOL retakes critical resistance levels and momentum indicators show improvement, the technical picture remains bearish. Market participants will be watching ETF activity, derivatives liquidations, and broader macro signals to gauge whether this rout has further to run or a durable turnaround is forming.


Leave a Comment
Comments (2)
Is this even true? $12.7m outflow doesnt look huge for ETFs, feels like panic headlines fueling selling. still, $1.66b liquidations is wild... who's prepared?
wow SOL ripping down that fast... liquidations hit hard, brutal shakeout. wonder if long holders get another chance near upper-50s or this just spirals further?