

5 Minutes
Ethereum climbs as CLARITY Act momentum rekindles
Ethereum edged higher, gaining roughly 1.8% to trade near $1,845 after renewed expectations for a Senate vote on the CLARITY Act. Lawmakers' comments, steady spot ETF demand and improving on-chain metrics have kept traders cautiously optimistic about ETH's near-term trajectory. Key technical levels and institutional flows will determine whether this recovery extends toward the July highs or stalls at nearby resistance.
Regulatory catalyst: what the CLARITY Act could mean for ETH
Representative Bryan Steil, who chairs the House Financial Services Subcommittee on Digital Assets, signaled that the CLARITY Act could reach the Senate floor as soon as next week. Passage of the bill would likely codify a federal framework for classifying and overseeing digital assets, potentially clarifying the status of ETH under a digital commodity regime. That regulatory clarity is being priced in by traders, because a favorable outcome could reduce legal uncertainty for exchanges, funds and institutional participants.
Polymarket traders raised the perceived chance of the bill becoming law in 2026 during hearings, though unresolved provisions around ethics rules and stablecoin yields have kept the probability below the majority threshold.

ETF inflows and DeFi metrics support demand
Institutional appetite for spot Ethereum products also strengthened last week. SoSoValue data shows net inflows of about $105 million into spot Ethereum ETFs between July 13 and July 17, the largest weekly intake since April. Those inflows coincided with rising decentralized finance activity on Ethereum, underlining how ETFs and on-chain usage can move together.
DeFiLlama reports Ethereum's total value locked around $40.5 billion, up from roughly $36 billion at the start of July. Over the past 24 hours the network processed nearly $979 million in decentralized exchange volume and roughly 2.46 million on-chain transactions, highlighting persistent demand for smart-contract activity and liquidity.
Technical outlook: critical price levels to watch
Ethereum's daily chart reveals a double-bottom formation near $1,511, with the neckline clustering around $1,847. That neckline overlaps the 0.786 Fibonacci retracement at about $1,853.82, creating a clear case: a decisive daily close above $1,854 would reopen the path to the recent $1,947 high and bring the 100-day exponential moving average near $1,939 back into play.

Ethereum daily price chart — July 18
If bulls overcome $1,854, measured targets from the double-bottom pattern point toward roughly $2,180. Some analysts are even more bullish on momentum continuation; with the $1,780 support intact, scenarios in the $2,200 to $2,400 range are being discussed by market commentators.
Momentum indicators
Daily momentum remains on the buyers side but shows signs of cooling. The MACD line sits above its signal line, indicating positive momentum, while the histogram has contracted compared with prior sessions. The relative strength index (RSI) is around the mid-50s, suggesting ETH is not in overbought territory yet and has room for further upside if buyers re-accelerate.

Short-term structure: the 4-hour picture
On the 4-hour timeframe, Ethereum is trading inside an ascending channel that has governed the recovery since late June. The channel's lower boundary converges with the previous Supertrend and sits near $1,830 — a level traders are defending. The channel's upper boundary approaches $2,040, but an active Supertrend resistance near $1,908 would likely need to be cleared before bulls can comfortably retest the July peak.

Ethereum 4-hour price chart — July 18
Chaikin Money Flow remains positive, corroborating the inflow narrative, but momentum and trend-resistance must align for a sustained run higher.
Leverage, liquidations and risk zones
CoinGlass data highlights dense clusters of leveraged positions between $1,860 and $1,870, with additional concentration around $1,900. On the downside, liquidity stacks near $1,810 and $1,790 could accelerate selling if those levels are breached, triggering forced deleveraging.
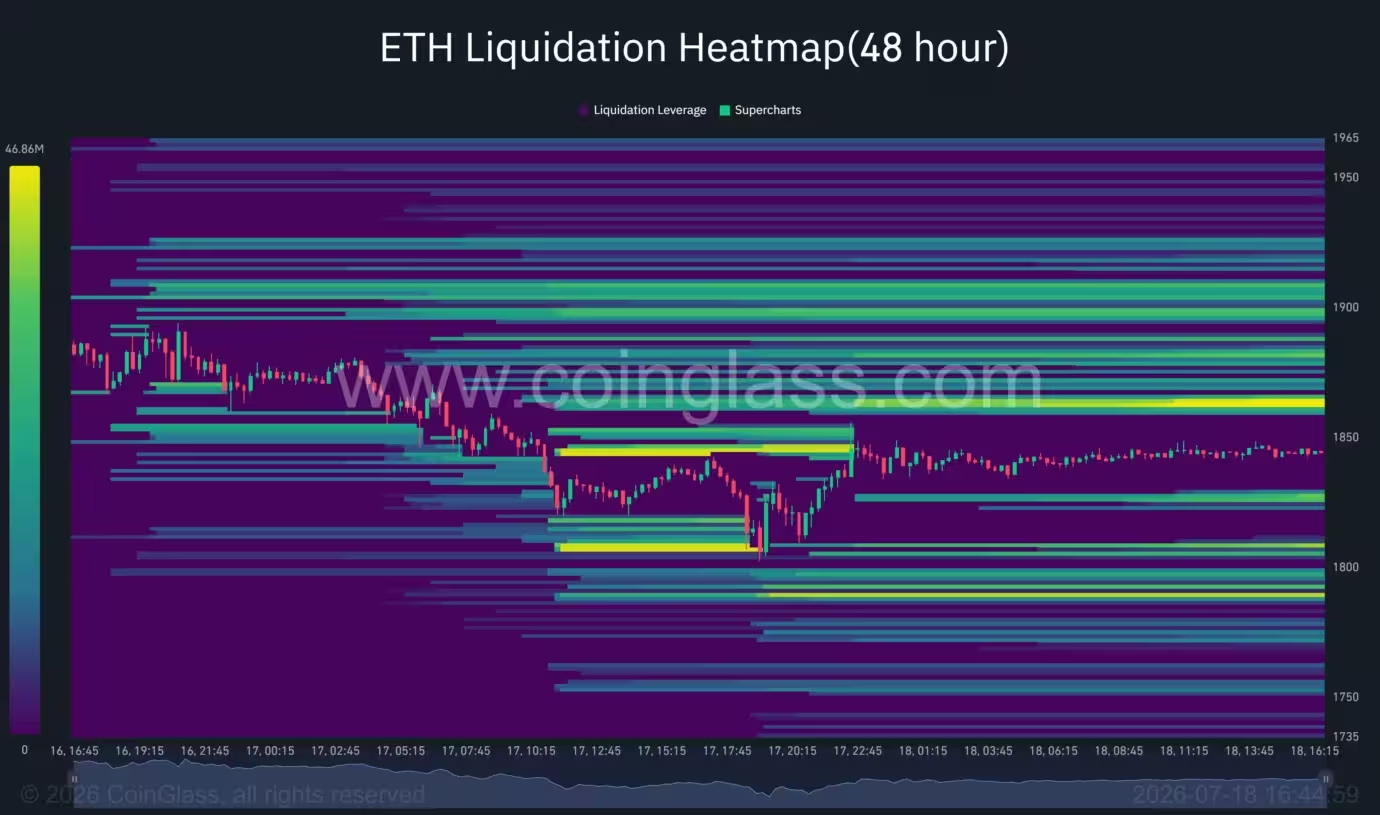
Ethereum liquidation heatmap
Analysts point to the $1,820–$1,850 band as decisive for ETH's next leg. If Ethereum holds above this range, another push toward $1,950 to $2,000 is likely. Conversely, a sustained close below $1,830 would threaten the 4-hour ascending channel and expose the 50-day EMA near $1,812, increasing the probability of leveraged long liquidations around $1,810.
A deeper break beneath the 61.8% Fibonacci retracement at roughly $1,780 would undermine the double-bottom setup and open the next major support zone near the 50% retracement about $1,729.
Macro and political risks
Beyond technicals and flows, geopolitical developments and regulatory uncertainty remain material risks. Escalating tensions in international arenas can weigh on risk assets, and any failure to resolve outstanding CLARITY Act disputes — notably ethics provisions and stablecoin oversight — could delay a Senate vote and remove a near-term catalyst supporting ETH. Traders should monitor both legislative progress and macro headlines as part of a comprehensive risk-management plan.
Bottom line
Ethereum's recovery is being underpinned by a mix of regulatory momentum, ETF inflows and stronger on-chain DeFi metrics. Key levels to watch are support at $1,830 and resistance around $1,854–$1,908. Maintaining the $1,820–$1,850 area will likely determine whether ETH can reassert upside towards $2,000 and beyond, while a decisive break below $1,780 would weaken the bullish thesis and expose deeper retracement targets. Traders and investors should weigh technical signals alongside evolving legislative and geopolitical developments when sizing positions in ETH and related crypto assets.


Leave a Comment
Comments (2)
Feels kinda overhyped, no? On-chain stats look solid but hinging on a bill is risky. If votes stall, 1,780 could flip fast, messy
Is this even true? ETFs inflows are real but the CLARITY vote feels shaky, lawmakers always surprise. Price action looks fragile, imo