
5 Minutes
Bitcoin dips toward $97,000 as ETF redemptions accelerate
Bitcoin has slipped back toward the $97,000 area as U.S. spot BTC ETFs posted one of their largest single-day outflows, adding fresh selling pressure to an already fragile market. At press time, Bitcoin traded around $97,527, down roughly 5.5% over the last 24 hours. Weekly and monthly performance has weakened as well: Bitcoin is about 4.3% lower over the past seven days, roughly 13% down in the last 30 days, and approximately 22% below its October peak of $126,080.
Market activity and derivatives signals
Trading volume surged amid the pullback, with spot and derivatives activity picking up as traders reposition. Total futures volume climbed more than 34% to an estimated $153 billion, while exchange open interest dipped about 2% to $66.65 billion. The combination of rising volume with slightly lower open interest suggests the market is undergoing a reset and deleveraging rather than establishing a clear directional trend.
Spot BTC ETF outflows: second-largest single-day redemption
U.S. spot Bitcoin ETFs recorded roughly $869 million in net outflows on Nov. 13, marking the second-largest daily withdrawal since ETFs launched. Grayscale’s Mini BTC led the redemptions with over $318 million, followed by BlackRock’s IBIT at about $257 million and Fidelity’s FBTC near $119 million. Large institutional redemptions of this magnitude typically reflect de-risking behavior and can suppress spot demand in the short term.
Institutional behavior and year-end positioning
Market commentators point to institutional profit-taking and tax-related positioning as important drivers behind the outflows. Gerry O’Shea, head of global market insights at Hashdex, told crypto.news that consolidation is being influenced by macro shifts and selling from longer-term holders. With expectations for a December U.S. rate cut fading, some institutional and long-term investors appear to be locking in gains ahead of year-end, intensifying downward pressure on prices.
U.S. market dynamics are central
Analysts from CryptoQuant and other data providers highlight that recent weakness is largely U.S.-driven. The Coinbase Premium Index has been negative for several weeks, indicating Bitcoin is trading at a discount in the U.S. versus other markets. This pattern implies stronger selling pressure during U.S. hours, often followed by partial recoveries overnight as global flows rebalance.
Macro backdrop: liquidity and equities
Macro factors have amplified the sell-off. A short-term U.S. fiscal surplus caused by a government shutdown tightened liquidity conditions, weighing on risk assets including crypto and crypto-related equities. Lower expectations for near-term Fed easing have reduced speculative demand. Market watchers expect conditions to stabilize once liquidity improves, which could relieve some downside pressure on Bitcoin.
Technical outlook: support under strain
Technically, Bitcoin remains in a bearish posture. Price sits below the major moving averages from the 10-day through the 200-day, signaling a broad downtrend. Strong resistance is forming in the $102,000–$110,000 zone, a range that Bitcoin must reclaim to confirm any meaningful recovery.
Momentum indicators show weakness but are nearing potential oversold territory: the relative strength index (RSI) is around 33 while MACD and the Awesome Oscillator remain negative. Short-term gauges hint at easing selling pressure, but the lower Bollinger Band still suggests the market is experiencing exhaustion and persistent sellers.
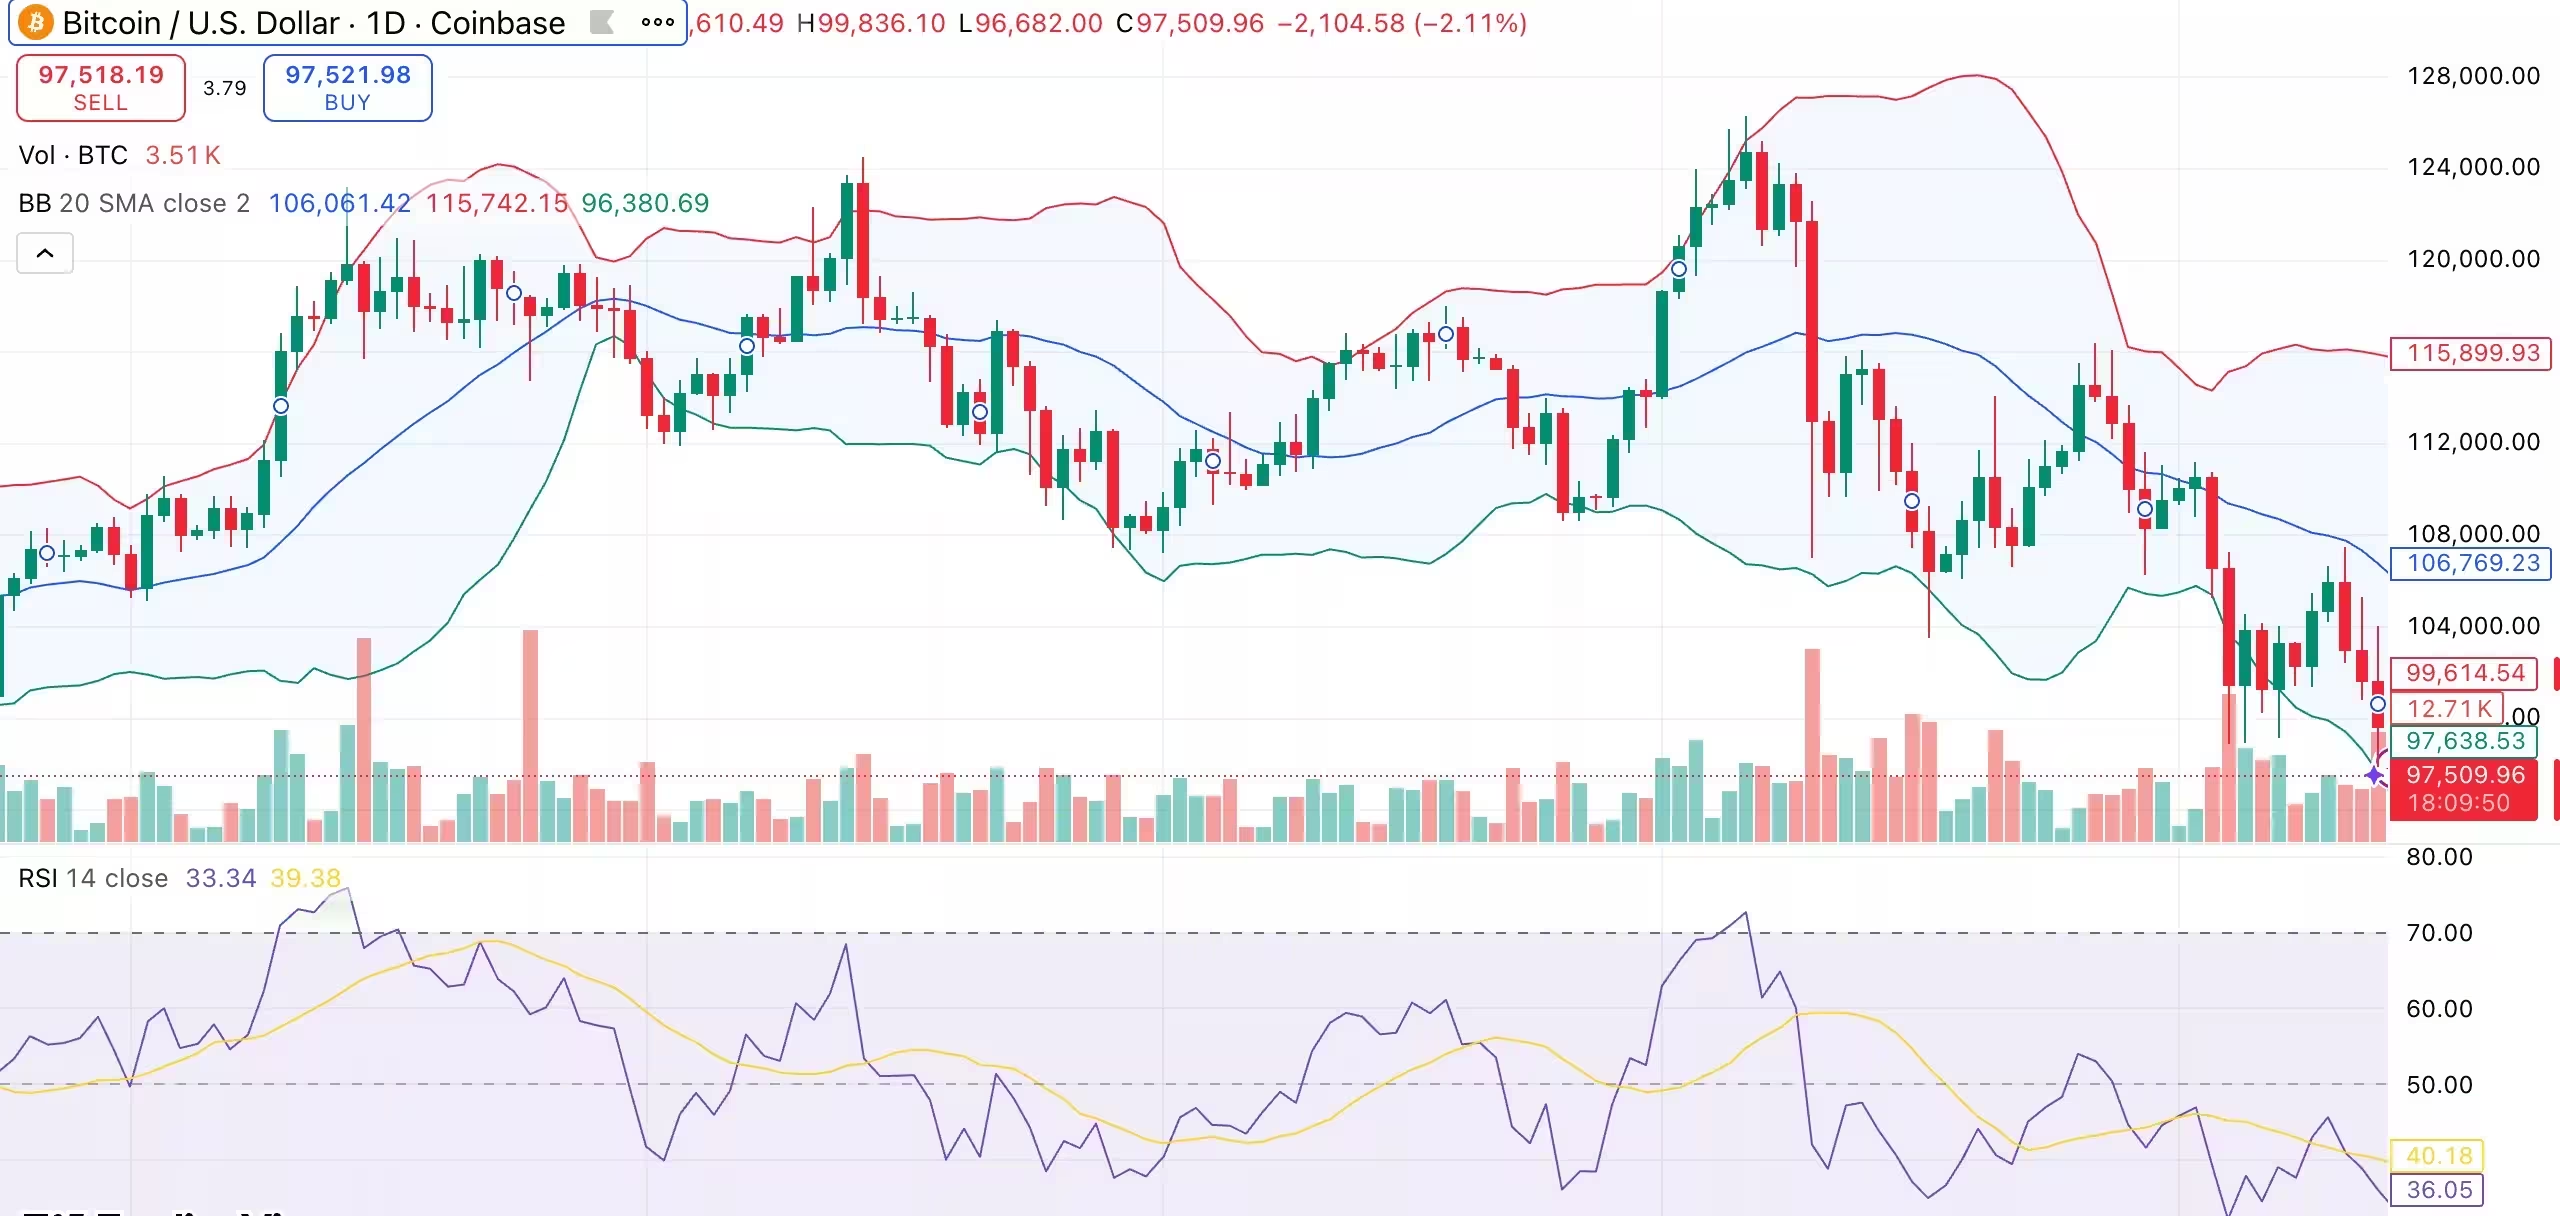
Bitcoin daily chart
Key levels to watch
Immediate support sits between $96,500 and $97,000; a breakdown below this zone could open a path toward $92,000 and then the $88,000–$90,000 range. Conversely, for a sustainable rebound, Bitcoin needs to reclaim $102,000, then challenge stronger resistance at $106,000 and $110,000. Traders and institutional desks will be monitoring spot ETF flows, futures open interest, and U.S. equity liquidity closely in the coming sessions.
What traders and investors should consider
Short-term traders should watch ETF net flows and the Coinbase Premium Index for market direction signals. Risk managers and long-term investors may view current volatility as a chance to reassess position sizing and dollar-cost-averaging strategies rather than attempting to time a bottom. Institutions adjusting exposure into year-end could keep pressure on prices until clearer macro and liquidity signals emerge.
In summary, accelerating spot BTC ETF outflows and U.S.-centric selling have pushed Bitcoin back toward $97K. While some technical indicators hint at near-term exhaustion, broader trend signals remain bearish until Bitcoin reclaims critical resistance above $102,000.
Source: crypto
Comments
Kellan
makes sense tbh. Spot ETFs pulling cash, macro tightening, BTC gets whipped. DCA if you believe long term or scalp, but dont overleverage. some days are just shakeouts
cryptlynx
hmm is this even true? $869m outflow in one day sounds wild. big institutions de-risking or just tax/window dressing? quick thought: be ready for volatility, could dip to 92k if selling keeps up. curious…
Leave a Comment