
3 Minutes
Ethereum holds critical $4,300 support after spot ETH ETF outflows
Ethereum is probing a key support level near $4,300 after U.S. spot Ethereum exchange-traded funds (ETFs) recorded their first net outflows in nine days. The short-lived withdrawals interrupted an eight-day inflow streak but appear to be a rotation rather than a change in institutional appetite for ETH.
Price action and market snapshot
At press time, Ethereum (ETH) traded around $4,352, down roughly 2.3% over 24 hours and 3.2% for the week. The token remains about 12% below its August 24 peak of $4,946. Spot trading activity stayed robust with $40.4 billion in volume over the past 24 hours, a 9% rise from the prior day. Derivatives metrics showed a mixed picture: futures trading volume climbed 21.5% to $93.6 billion while open interest dipped 0.83% to $59.2 billion, hinting that some traders locked in profits while keeping positions open.
Spot ETH ETFs: a brief withdrawal, not a capitulation
Data from SoSoValue indicated U.S. spot Ethereum ETFs logged $8.54 million in net outflows on Oct. 9, snapping consecutive daily inflows. Despite the overall outflow, BlackRock’s ETHA added $39.29 million in fresh subscriptions, while Fidelity and Bitwise saw withdrawals of $30.26 million and $8.07 million, respectively. On balance, institutional demand for ETH remains strong: spot ETH ETFs accumulated more than $1.3 billion in net inflows during the first week of October.
Analysts frame the Oct. 9 redemptions as normal rotation into Bitcoin, which garnered nearly $198 million in inflows on the same day. Market watchers expect momentum to return as several catalysts approach, including BlackRock’s pending staking ETF decision by the end of October and upcoming U.S. consumer price index (CPI) data that could sway risk sentiment.
Technical outlook: consolidation rather than breakdown
Technical indicators suggest consolidation rather than a fresh downtrend. The Relative Strength Index (RSI) sits near neutral at 49, signaling balanced buying and selling pressure. Momentum and MACD remain constructive, and ETH is trading slightly below its 10- and 20-day moving averages near $4,450. Longer-term 50- and 100-day moving averages are still rising, creating layered support between roughly $4,000 and $4,300.
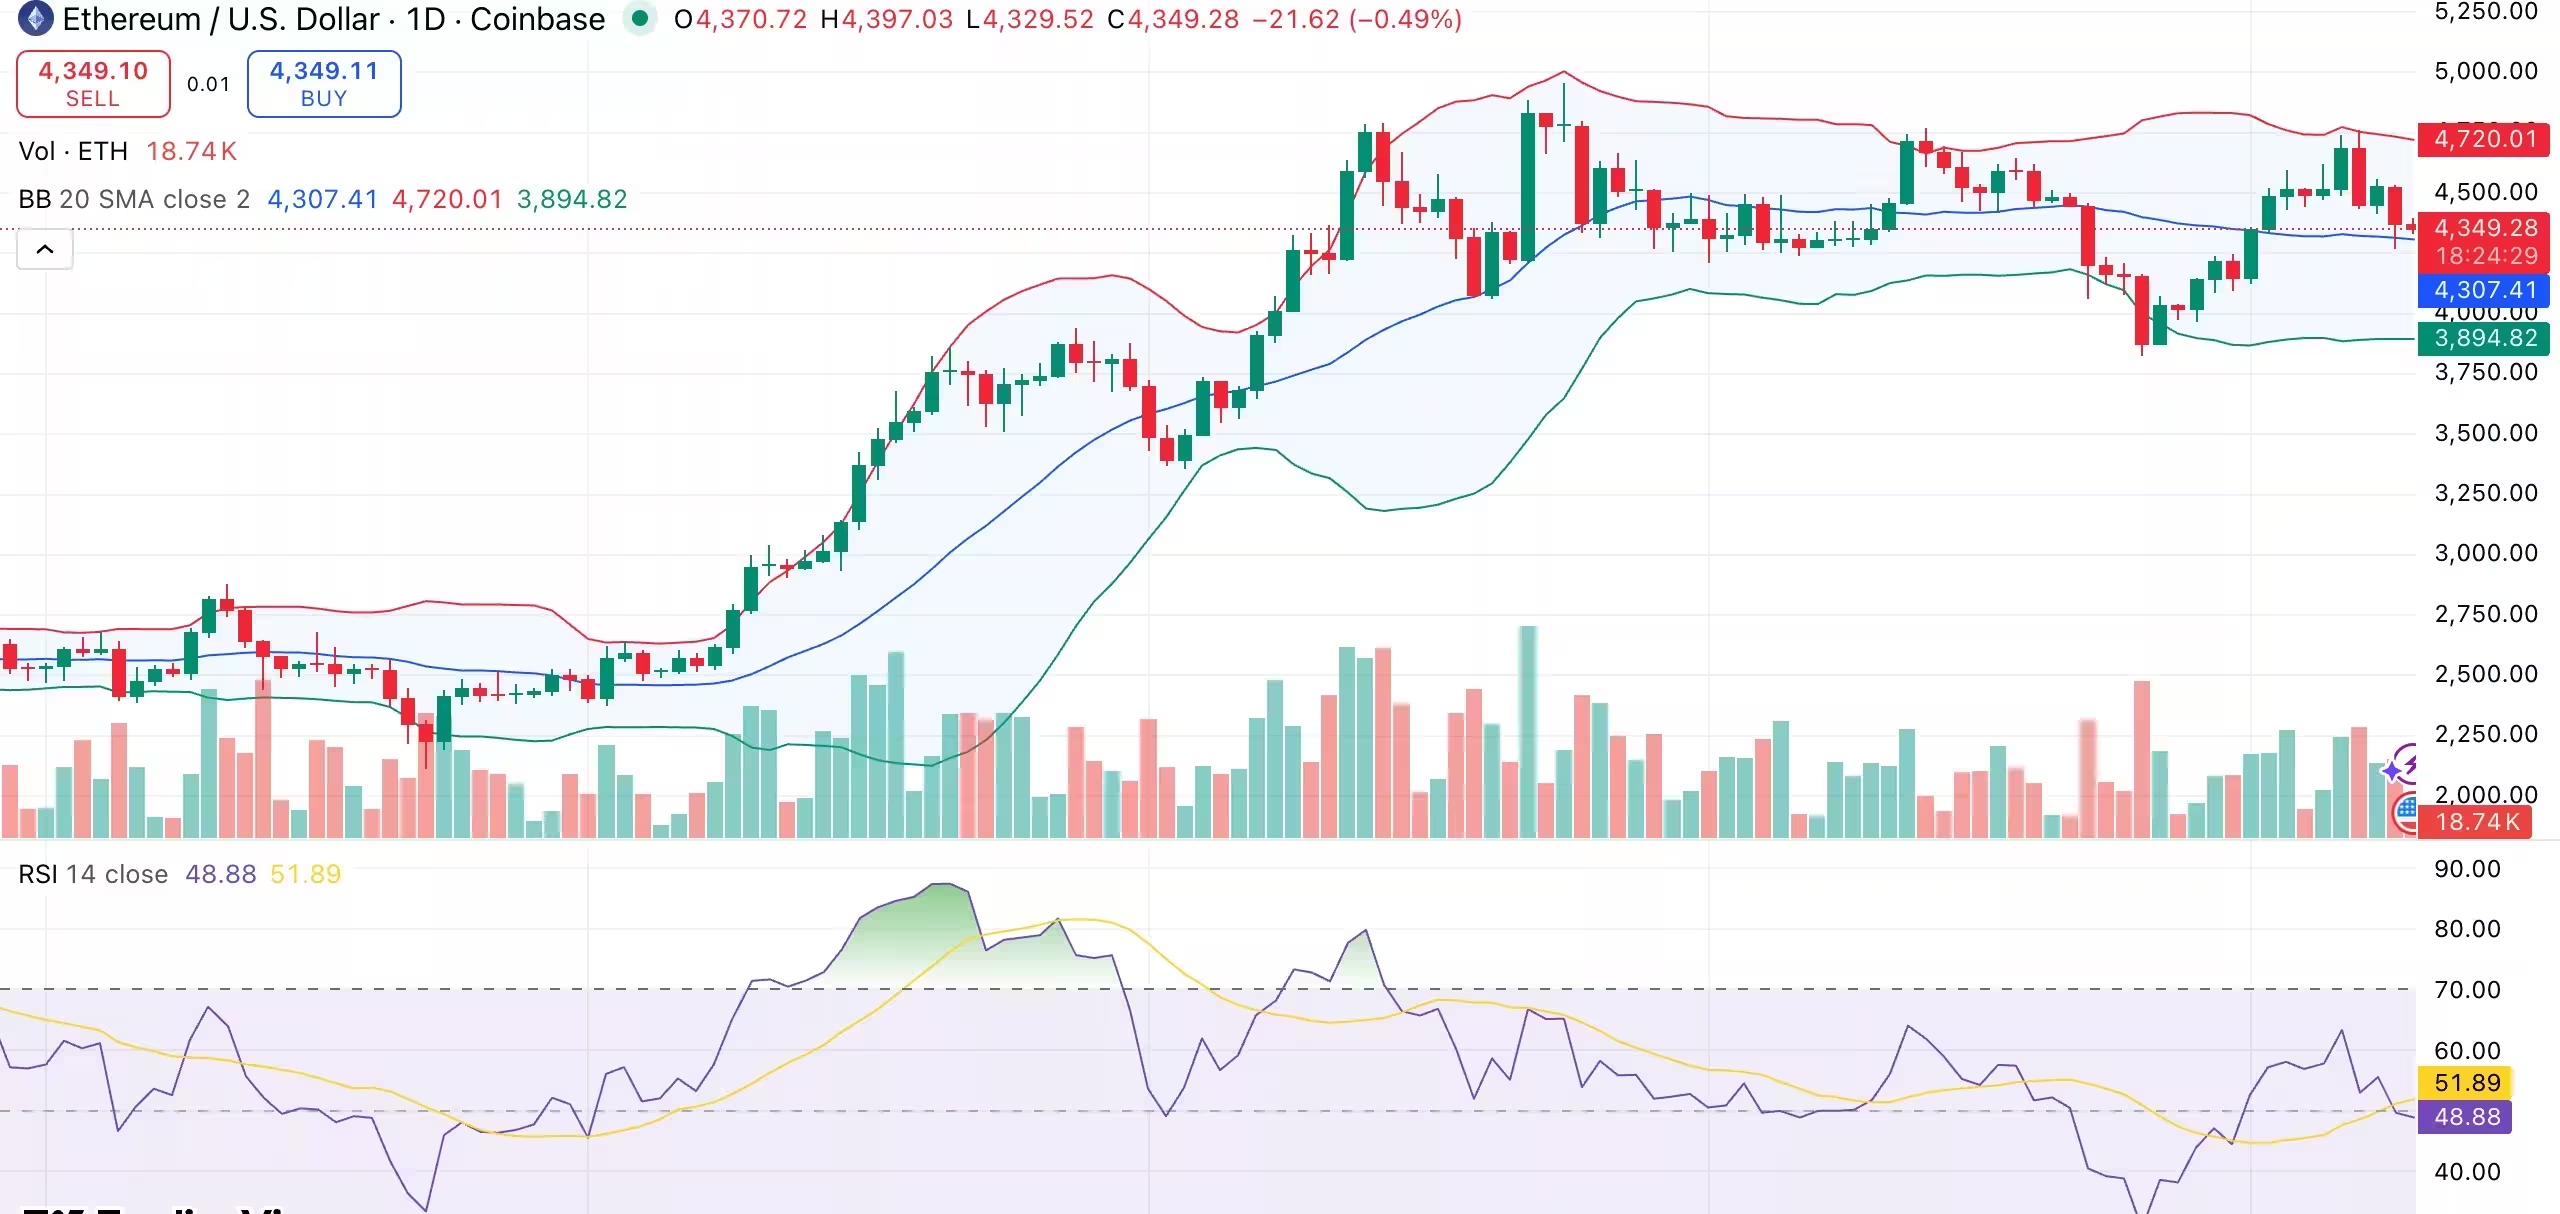
Ethereum daily chart
Traders are monitoring the $4,300 zone closely: if it holds, a rebound toward $4,600 resistance is anticipated. A decisive break above that level could pave the way to the $4,950–$5,000 range, while a downside breach might lead to a retest of the next meaningful support around $3,900. Volume, ETF flows, and macro triggers like CPI and regulatory moves tied to staking products will likely dictate the next directional leg for ETH.
Overall, the current pullback looks like a consolidative pause inside a broader accumulation phase rather than the start of a sustained decline. Institutional flow data and derivatives behavior will remain key indicators to watch for signs of renewed upward momentum.
Source: crypto
Leave a Comment