
3 Minutes
XRP outlook: can March end the downtrend?
XRP has seen heavy losses since October 2025, trading roughly 50% below recent highs and enduring five straight monthly declines. Technical indicators and on-chain metrics are now pointing to a potential rebound: a classic double-bottom pattern has formed around the $1.30–$1.35 support zone, while whale selling appears to be easing. Together, these developments raise the possibility of a 20% or larger rally in March if price action confirms a breakout.
Key takeaways
- A double-bottom breakout above the $1.50 neckline targets roughly $1.68–$1.70, about 20% upside.
- Large-holder flows have cooled from heavy distribution, and addresses holding 1,000+ XRP are showing renewed accumulation.
- Failure to clear resistance at the 50-day EMA or fresh macro liquidity shocks could invalidate the bullish scenario.
Double bottom setup targets a March rally
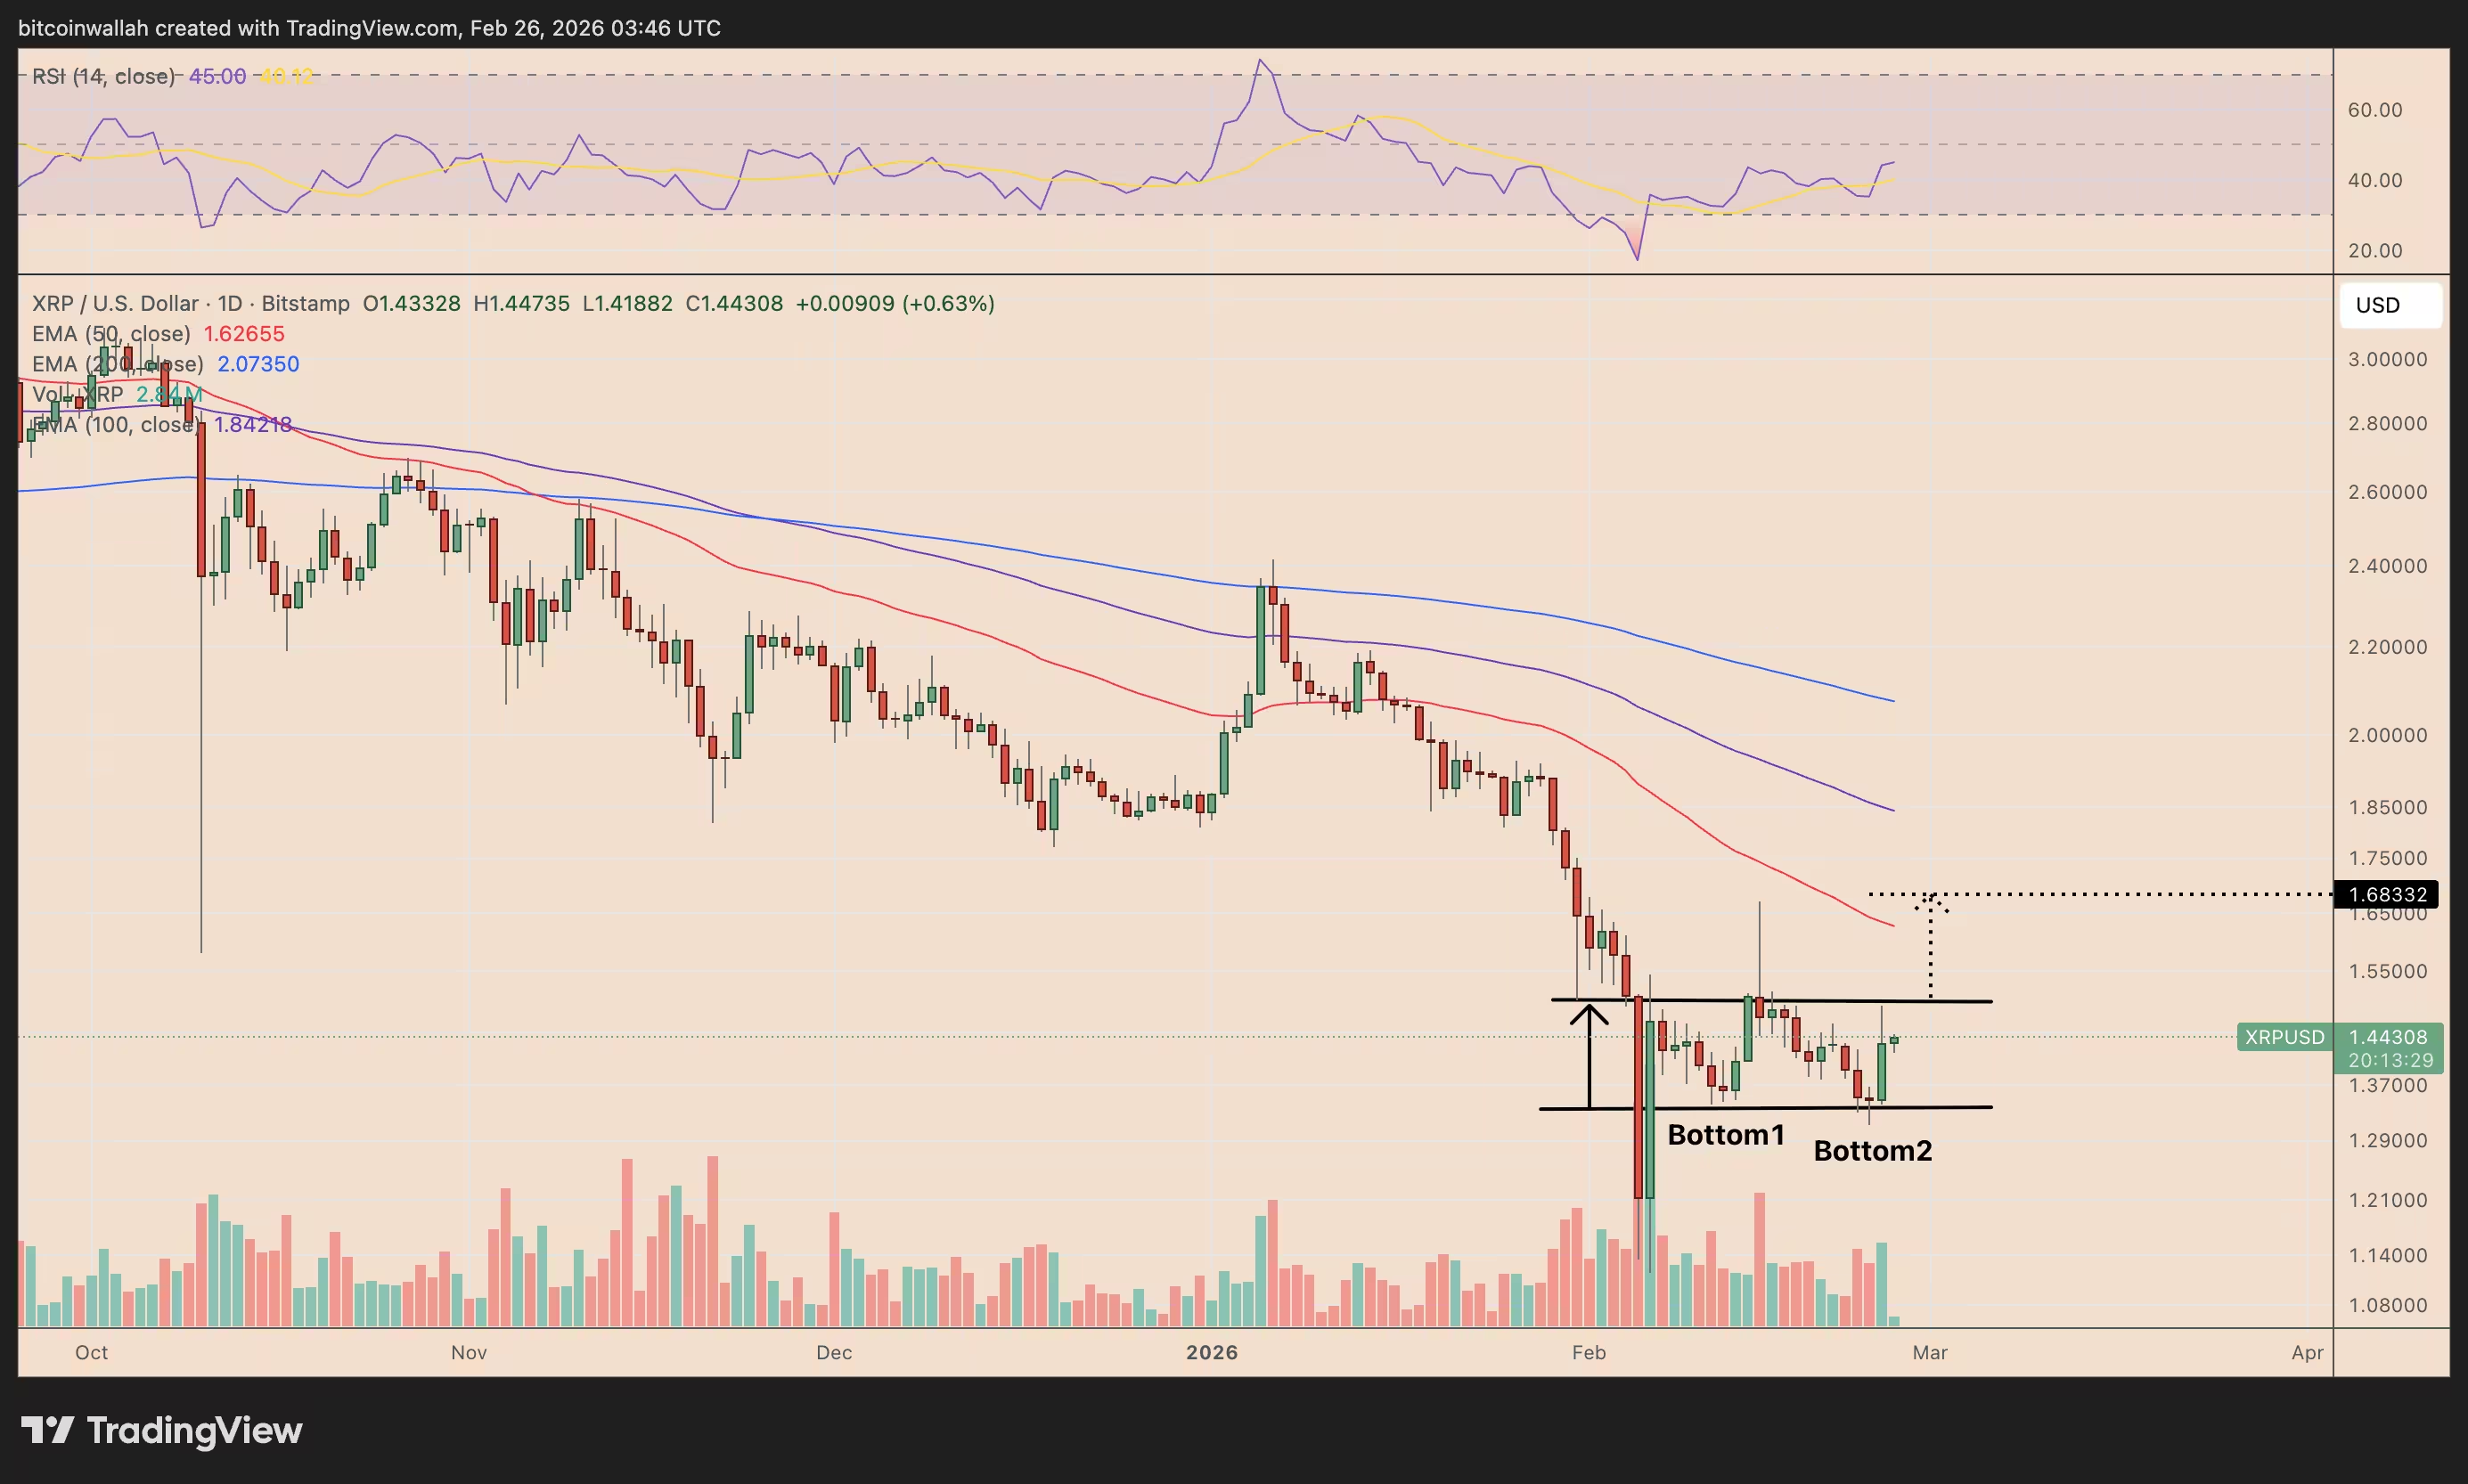
A double bottom forms when price tests the same support level twice and then reverses, typically resolving after a breakout above the pattern’s neckline. For XRP, that neckline sits close to $1.50. A decisive daily close above that level would increase the probability of a move toward $1.68–$1.70 in March — roughly 20% above current quotes — when measured by the pattern’s height.
XRP/USD daily chart.
Traders watching XRP price action should look for higher volume on the breakout and follow-through above $1.50. A weak breakout or immediate rejection would invalidate the pattern and keep the bearish bias intact.
Whale flows and accumulation improving the technical case
On-chain data show a marked reduction in net whale outflows. CryptoQuant’s 90-day moving average for whale flow has moved from deep negative territory in December to near-neutral levels more recently. Specifically, whale flow slid from roughly -33.50 million XRP to about -3.29 million XRP, signaling that large-scale selling pressure has abated even as the market corrected.
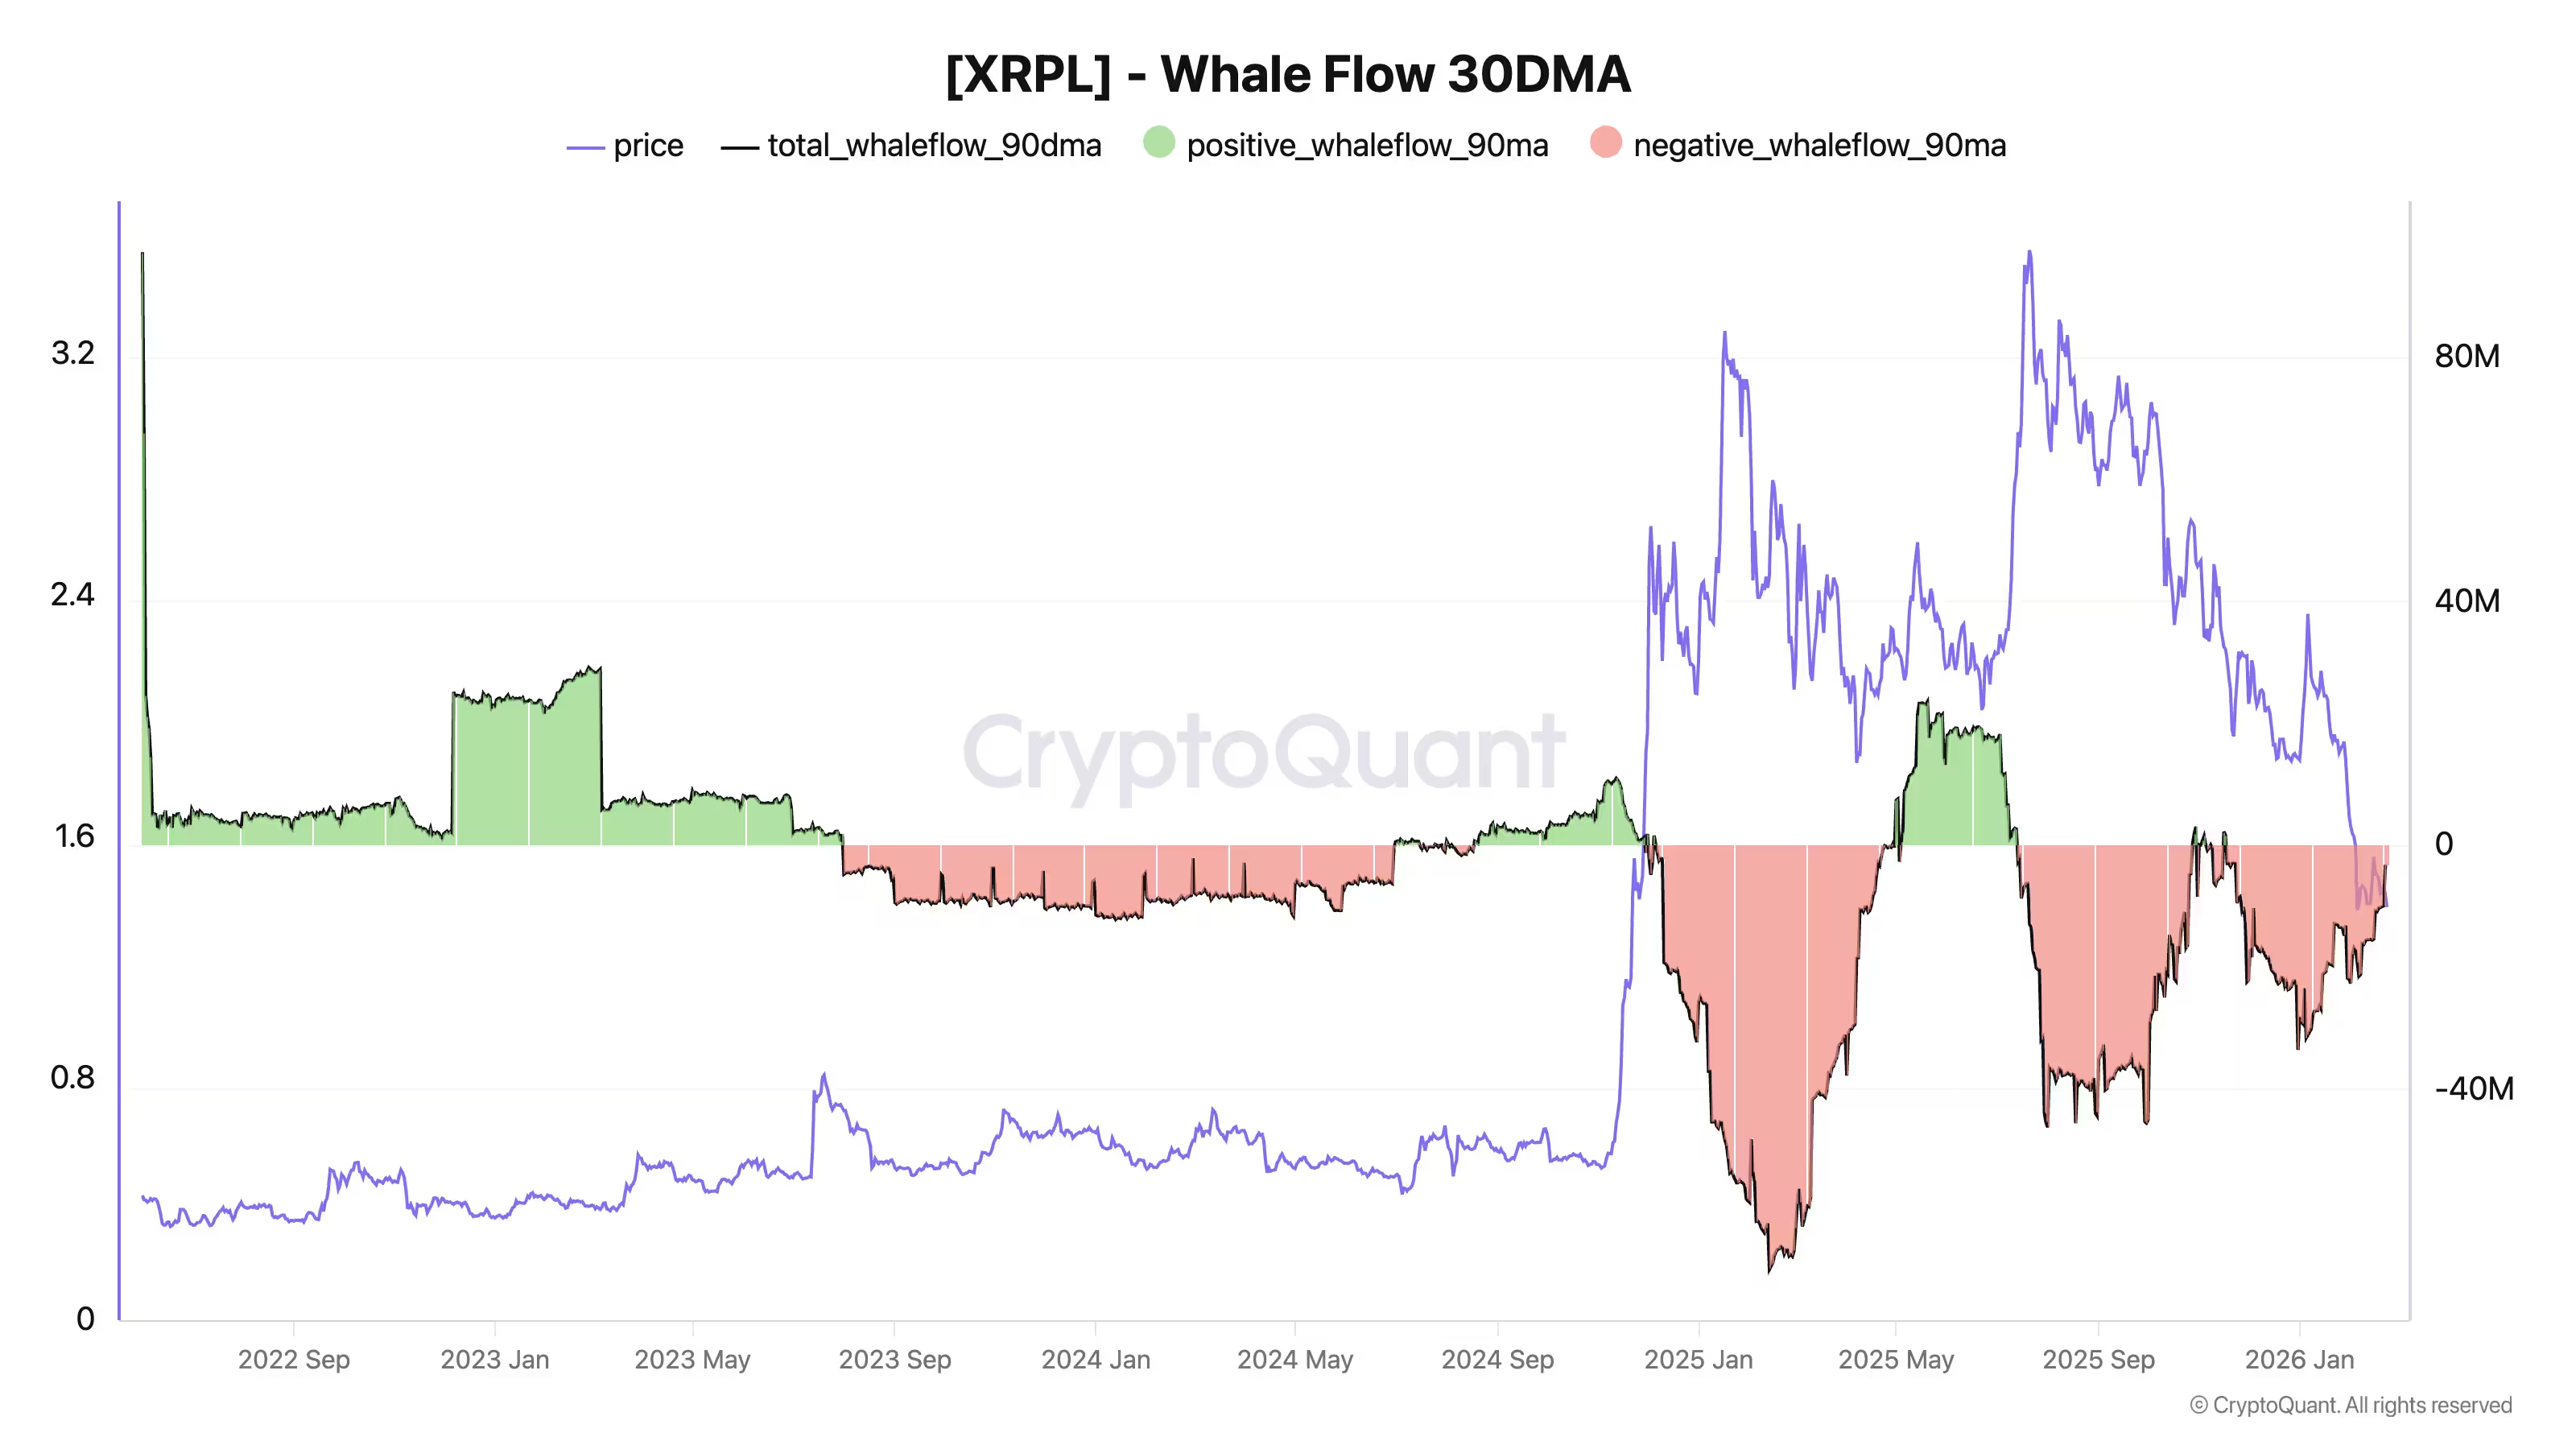
XRPL whale flow 90-day moving average vs. price.
At the same time, supply held by addresses with at least 1,000 XRP has resumed an upward trajectory, according to Glassnode, suggesting larger holders may be re-accumulating around current lows.
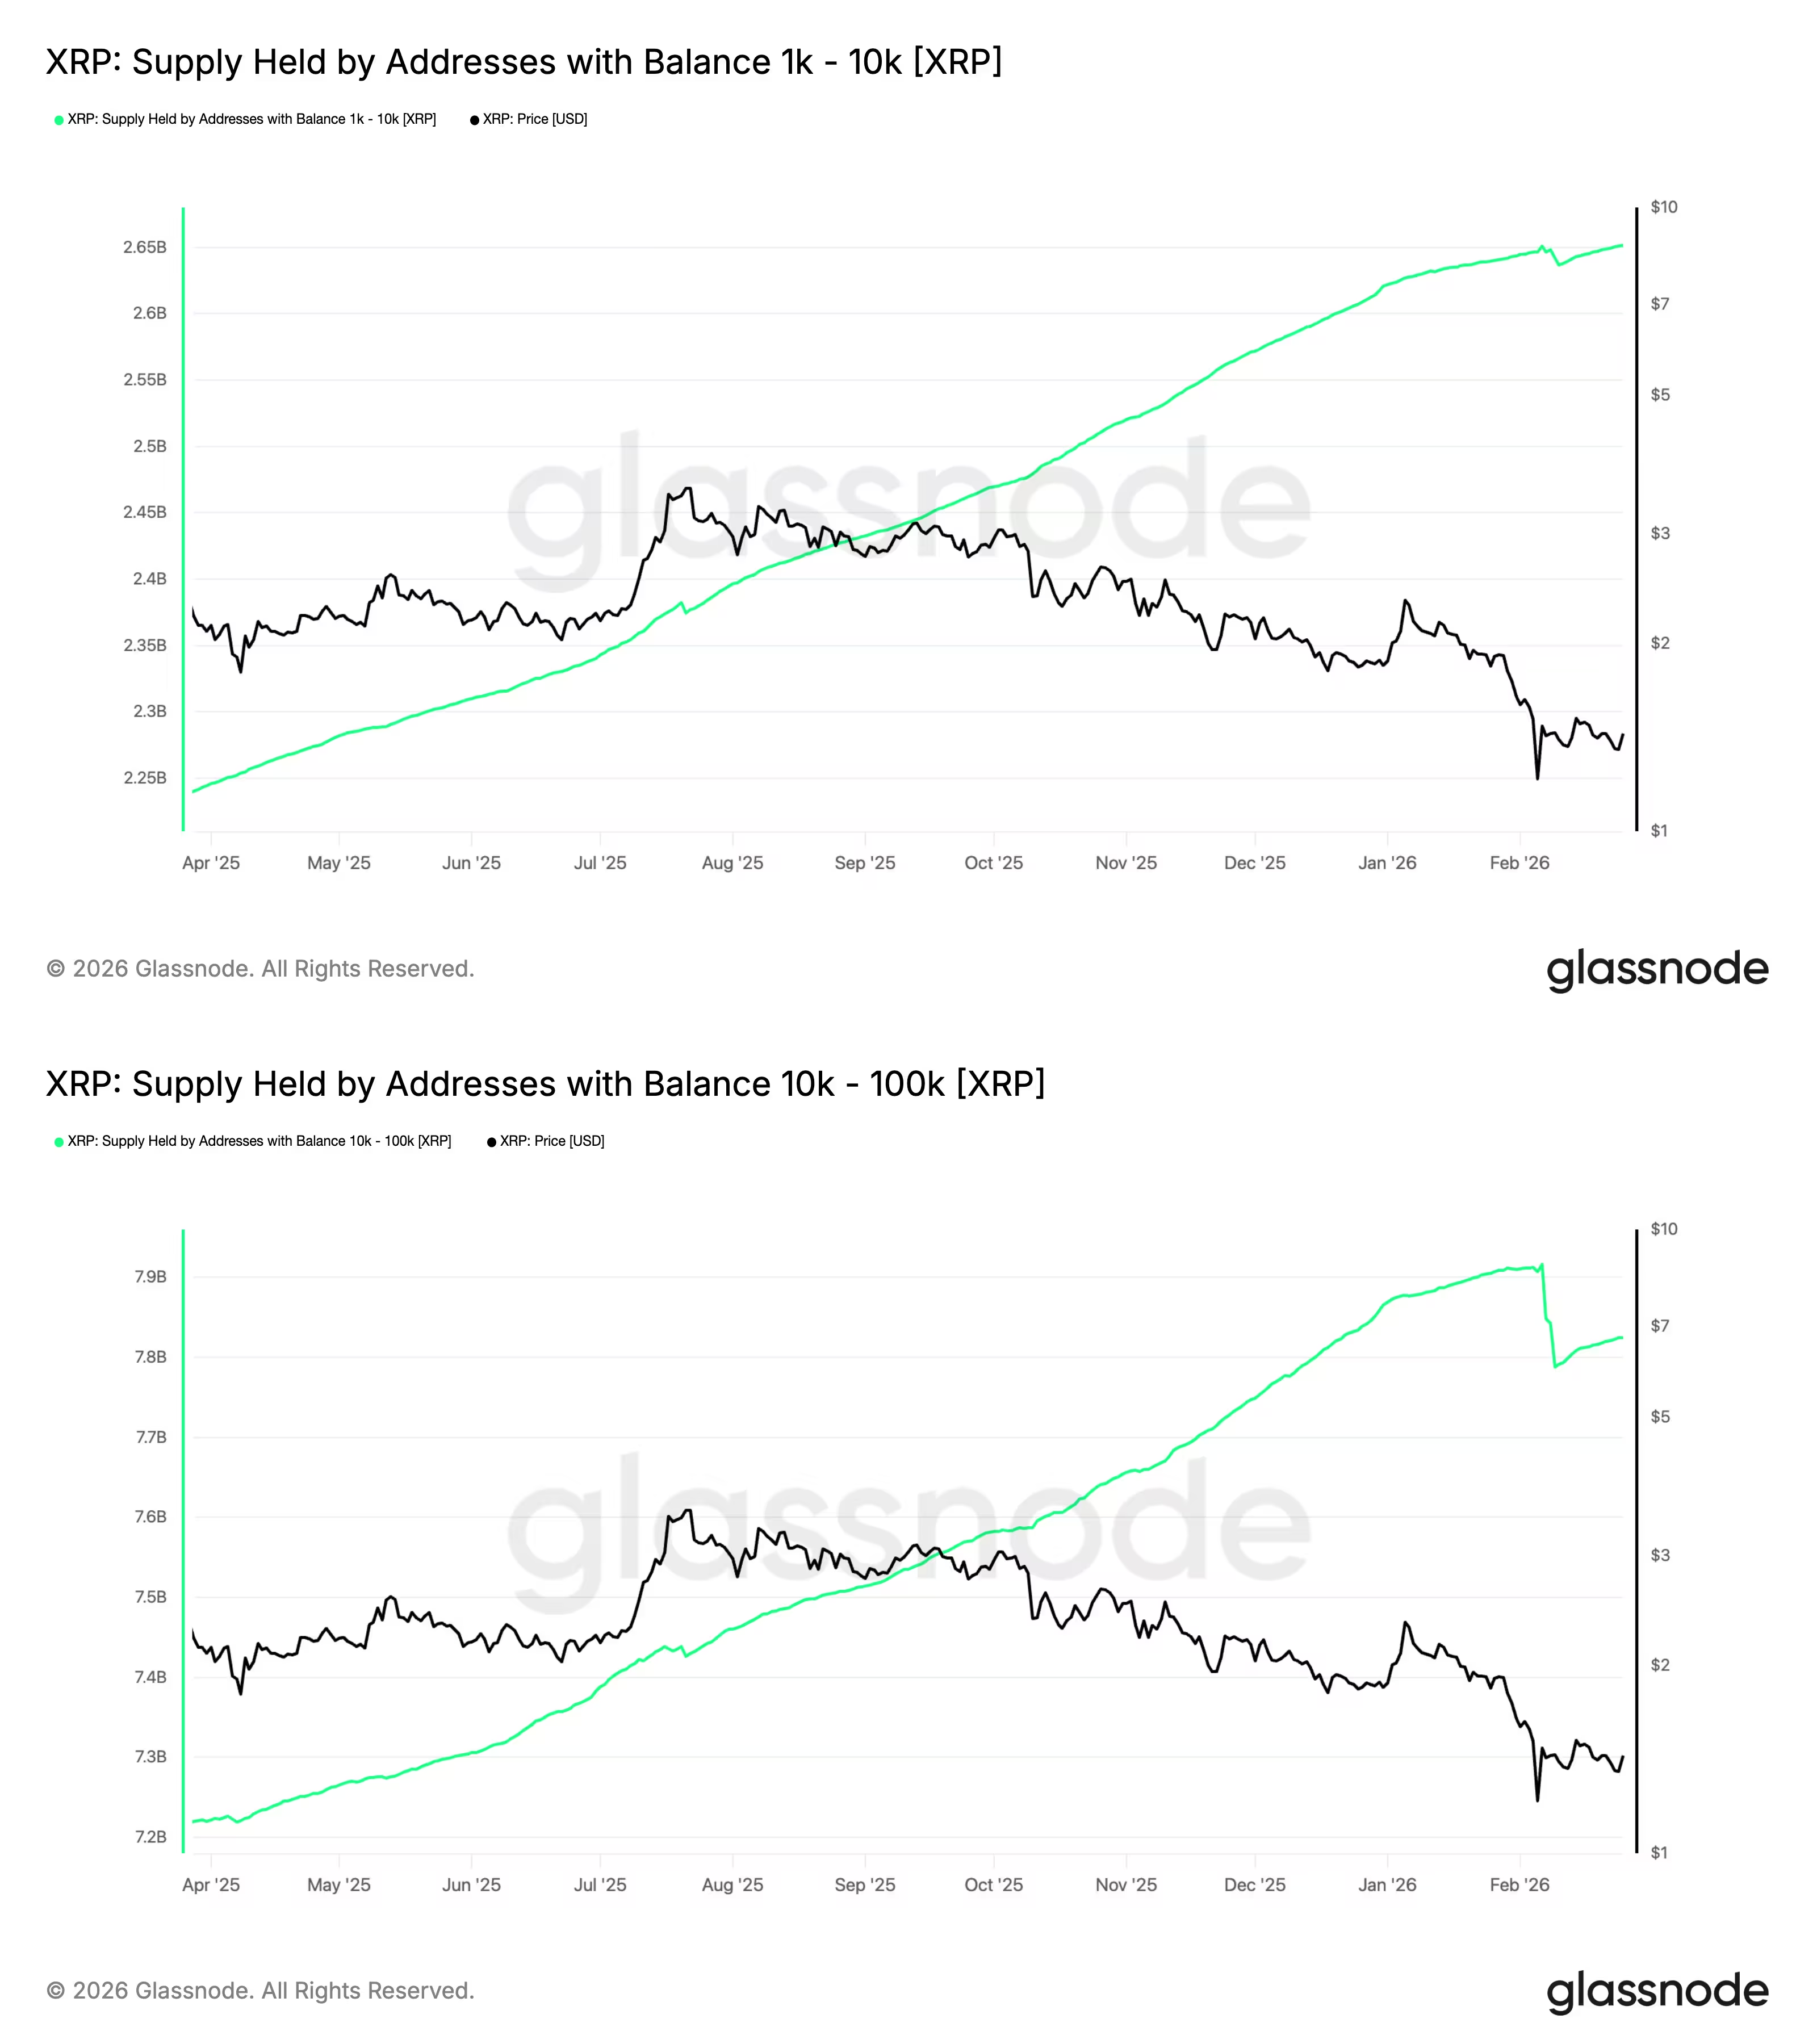
XRP supply held by addresses with at least 1,000 token balance.
A comparable easing of whale distribution in April 2025 preceded a >50% rebound for XRP, so a clean flip of whale flow indicators to net accumulation would strengthen the bullish scenario toward the $1.68–$1.70 target.
Risks: resistance and macro headwinds
Technical resistance and macro factors could derail a breakout. The $1.68–$1.70 target sits above the 50-day exponential moving average (50-day EMA), a level XRP repeatedly failed to breach through February. If price gets rejected at the EMA, XRP could roll over into a bearish continuation pattern — a potential bear pennant — with downside near $1.00, roughly 30% below current prices.
XRP/USD daily price chart.
Beyond technicals, macro liquidity drivers remain relevant. Renewed risk-off sentiment tied to AI-driven rotations, geopolitical friction such as U.S.–Iran tensions, or a broad flight from altcoins into perceived safe havens could sap momentum and prevent a sustained breakout even if chart patterns look favorable.
What traders should monitor
Watch the $1.50 neckline and confirmation volume for a valid double-bottom breakout. Monitor CryptoQuant whale flows and Glassnode large-holder balances for signs of net accumulation. Keep the 50-day EMA and global risk events on your radar — they will determine whether XRP can translate the technical setup into a meaningful March rally.
Comments
No comments yet.
Leave a Comment