

Bitcoin edges higher ahead of the Fed decision
Bitcoin reclaimed levels above $80,000 at the time of reporting, trading near $80,800 after a volatile 24 hours that saw prices move between $79,416 and $81,159. The rebound — roughly a 1% gain on the day — comes as market participants weigh improving ETF flows, notable on-chain exchange outflows and renewed geopolitical uncertainty ahead of the U.S. Federal Reserve’s policy announcement on October 28.
Key takeaways
- Bitcoin temporarily recovered above $80,000 but remains below major resistance bands around $81,400–$82,500.
- U.S. spot Bitcoin ETFs recorded renewed inflows totaling about $110.3 million on October 26 after consecutive withdrawal days.
- On-chain data provider Santiment reported a net removal of 14,942 BTC from exchanges, the largest single-day outflow in five weeks.
- Heightened tensions in the Middle East and reports of potential U.S. military operations against Iran have added another layer of macro uncertainty.
- Near-term technical support sits at $80,000, while $81,400–$82,500 represents the threshold needed to validate a stronger upside move.
Market snapshot: price, volume and market cap
According to crypto.news market data, BTC was trading around $80,800 at the time of writing, with a 24-hour trading range between $79,416 and $81,159. Daily volume hovered near $23.5 billion and Bitcoin’s market capitalization stayed above $1.62 trillion. Despite the bounce, BTC has yet to clear the $82,000 area convincingly, leaving the recent move short of a confirmed breakout.
ETF flows and institutional demand
Institutional flows showed signs of improvement on October 26 after two days of heavy redemptions from U.S. spot Bitcoin ETFs. The funds attracted about $110.3 million in inflows that day, largely driven by BlackRock’s IBIT product. This recovery followed sizable outflows on October 22–23 — roughly $773.5 million combined, including a single-day withdrawal of about $635.6 million on October 22.
Although the inflow on October 26 marked a respite, SoSoValue’s October 27 data pointed to a smaller net daily inflow near $24.54 million, underlining that institutional demand remained uneven. Cumulative ETF inflows remain substantial year-to-date — near $57.32 billion — but daily buying has not yet shown consistent strength following the prior week’s heavy withdrawals.
Why ETF flows matter for BTC
Spot Bitcoin ETF flows are closely watched because they can reflect institutional appetite and directly influence exchange liquidity and price action. Renewed inflows can help support price, whereas sustained withdrawals often create downward pressure — particularly when combined with leveraged liquidations in spot and derivatives markets.
On-chain dynamics: major exchange outflows

On-chain metrics painted a contrasting picture: analytics firm Santiment reported a net movement of roughly 14,942 BTC off exchanges — the biggest single-day outflow in five weeks. That kind of withdrawal is often read as a reduction in immediate selling pressure, since funds leaving exchanges are less readily available for quick liquidation.
While significant, exchange withdrawals are not definitive proof of accumulation: transfers can represent custody shifts, internal platform movements, or transfers to cold storage. Nevertheless, large net outflows often correlate with lower immediate selling availability and can support prices if buying demand emerges.
Macro calendar: the Fed and economic data
The Federal Reserve’s October 28 announcement is the focal macro event for crypto traders this week. Markets are parsing guidance on interest rates and looking for commentary from Fed officials on inflation dynamics. The policy decision is also arriving amid a heavier macro slate that includes third-quarter U.S. GDP, personal consumption expenditures (PCE) inflation figures for September and quarterly earnings from major technology companies.
Most forecasts expect the Fed to hold the federal funds target at 3.75%–4.00% after the September hike. However, any suggestion from officials that another rate increase could come in December would likely weigh on risk assets, including Bitcoin, while a more dovish tone could give BTC room to extend gains.
CryptoQuant research head Julio Moreno highlighted that spot demand contracted through October and that the firm’s Bull Score Index dropped from 90 to 60, signaling less favorable market breadth and momentum.
Moreno flagged technical measures to watch in a weakening market: the 365-day moving average at $77,585, the trader realized price at $74,041 and the 200-day moving average at $73,028.
Geopolitical risk: Iran tensions and oil price implications
Reports about U.S. military preparations relating to Iran have reintroduced geopolitical risk into the market mix. An October 28 Wall Street Journal article said U.S. officials alerted several Gulf partners about the possibility of a short, intense campaign after the November 3 midterm elections. Details included deployment of air-defense systems and coordination with regional forces, but no final decision to strike had been reported.
Geopolitical flare-ups can push oil prices higher, which in turn can exacerbate inflation expectations. Rising energy costs complicate the Fed’s policy outlook and could increase volatility across equities and crypto. Bitcoin’s historical performance during geopolitical stress has been mixed: some traders treat BTC as an inflation hedge or alternative asset, while in other episodes it has traded like a risk-on instrument, falling with broader risk assets when liquidity tightens.

Technical analysis: resistance, support and momentum
Bitcoin’s near-term technical picture remains cautious. Daily indicators placed BTC near $80,915 — beneath the nine-day moving average (~$81,416) and the 21-day moving average (~$81,905). The shorter moving average sitting below the longer establishes a bearish crossover, while the Relative Strength Index (RSI) near 45.5 indicates that buying momentum has not fully recovered.
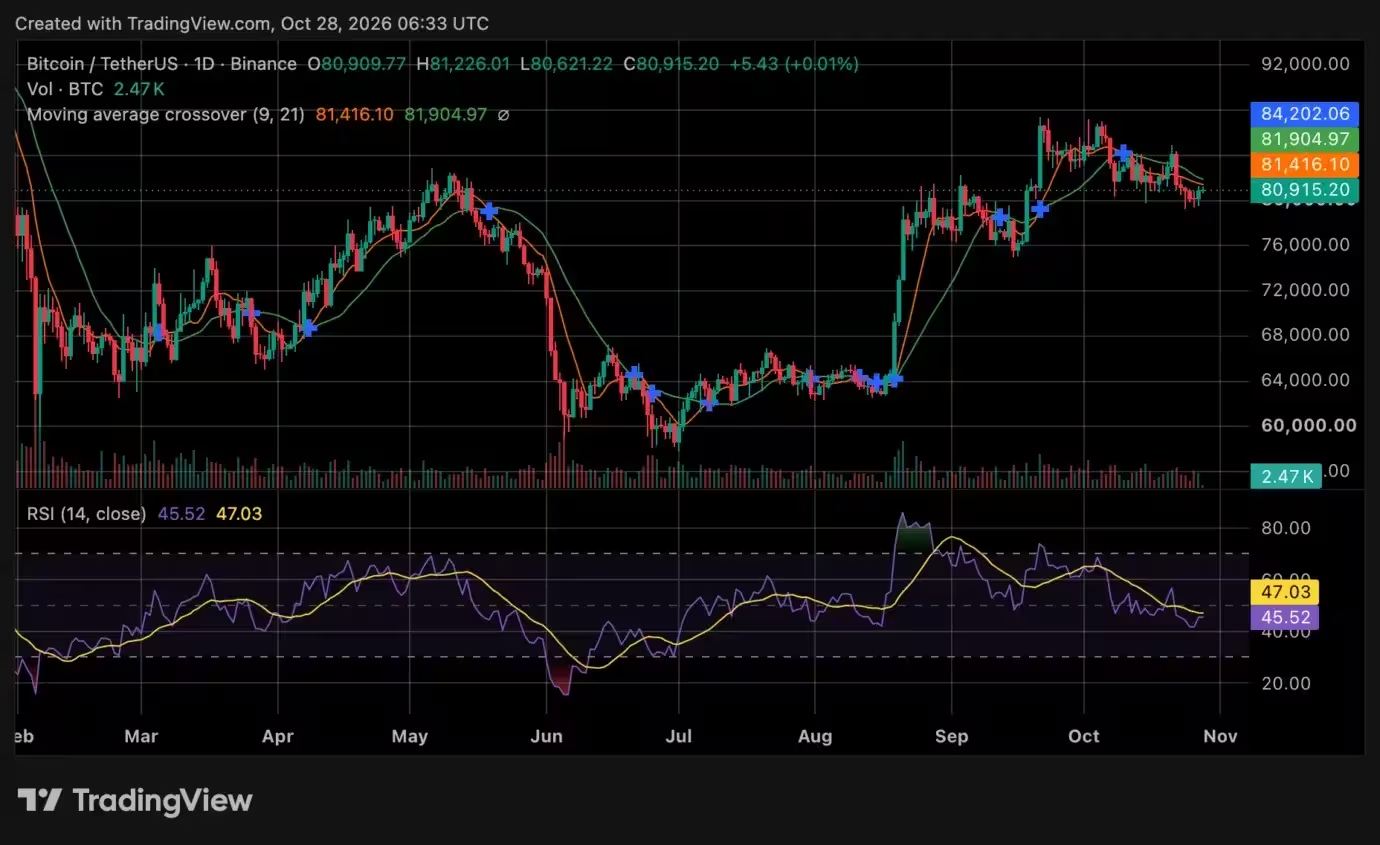
Bitcoin price chart
Crypto analyst Rekt Capital emphasized the importance of reclaiming $81,400 on a multi-day close. Failure to do so would likely reinforce that area as resistance; a successful recovery above those levels would increase the odds of testing the $82,000–$82,500 zone.
Immediate support is visible at $80,000, followed by $78,000 and $76,000 if selling intensifies. On the upside, a move above the short-term moving averages could put $84,202 and then the $86,000 region back in focus.
Historical context: midterm seasonality
Analyst Ali Martinez pointed out that Bitcoin posted negative returns in Q4 during the last three U.S. midterm election cycles (2014, 2018 and 2022). While historical patterns can offer context, they do not guarantee future performance, and 2026’s unique macro and geopolitical backdrop could drive different outcomes.
Outlook: what traders should monitor
For traders and investors, key items to watch in the near term include:

- The Federal Reserve’s October 28 statement and subsequent commentary for clues on the path of rate policy.
- Daily ETF flows for signs of consistent institutional buying or continued withdrawals.
- On-chain exchange balances, especially if large outflows persist and coincide with rising spot demand.
- Geopolitical headlines related to Iran and oil market responses that could influence inflation expectations.
- Technical action around $81,400–$82,500 (resistance) and $80,000 (support).
In summary, Bitcoin’s recent gain above $80,000 is encouraging but not yet decisive. Renewed ETF inflows and significant exchange withdrawals offer support, yet macro forces — from Fed policy to geopolitical risks — could rapidly shift sentiment. Traders should remain disciplined, monitor liquidity and risk indicators closely, and consider both on-chain signals and macro updates when sizing positions in BTC or related crypto assets.

Leave a Comment
Comments
No comments yet. Be the first.