

Bitcoin retraced from last week’s surge above $87,000 as renewed US–Iran tensions rattled risk assets and interrupted Bitcoin’s September rebound. The pullback pushed BTC below $84,000 during Monday trading before prices stabilised near the $84,000–$85,000 range as traders weighed geopolitical risk, macro data and continued inflows into spot Bitcoin ETFs.
Market snapshot
- BTC briefly dropped under $84,000 after hitting a seven-day high above $87,000. - U.S. spot Bitcoin ETFs recorded meaningful net inflows, drawing $2.39 billion over the Sept. 21–25 trading week. - Geopolitical developments around the Strait of Hormuz and volatile oil markets increased risk-aversion across asset classes. - Technical indicators show buying pressure remains positive but momentum has cooled.
Why geopolitics pushed Bitcoin lower
Renewed uncertainty between the United States and Iran shocked risk-on positioning and lifted safe-haven demand, pressuring growth-sensitive assets including equities and higher-beta cryptocurrencies. The immediate catalyst was the rejection by U.S. leadership of Iran’s proposal tied to a seven-day pause in hostilities and reopening the Strait of Hormuz. That move injected fresh uncertainty into oil supply perceptions and sent crude prices higher, which in turn affected inflation and bond-yield expectations.
Iran’s foreign ministry framed its proposal as an opening for diplomacy, but Tehran also warned it was prepared for renewed confrontation if negotiations failed. Meanwhile, U.S. political statements left open the possibility of additional military action. Those cross-currents elevated market risk premia and pushed Treasury yields higher, putting pressure on BTC despite strong inflows into spot Bitcoin ETFs.
Oil reacted quickly: WTI crude traded above $93 per barrel during the early session, with Brent showing similar gains as traders priced in potential disruptions through the Strait of Hormuz, a vital shipping route for Gulf oil and LNG exports. Higher oil prices can feed into inflation data, complicating the Fed’s policy calculus and increasing volatility across crypto and traditional markets.
.avif)
ETF flows and institutional demand
Spot Bitcoin ETF inflows stayed robust
Despite the pullback in price, US spot Bitcoin ETFs continued to attract institutional capital. Farside Investors data cited by crypto.news showed $2.39 billion of net inflows during the Sept. 21–25 week, with BlackRock’s IBIT accounting for roughly $1.16 billion of that total. All trading sessions in the week recorded positive flows, underlining consistent demand from long-term and institutional buyers.

The resilience of ETF inflows has been a key structural driver behind BTC’s third-quarter gains. Spot ETF accumulation helped push BTC above $87,000 after the Fed raised its target rate range to 3.75%–4.00% mid-September, a period that also saw large on-chain accumulation among mid-sized wallets.
On-chain and derivatives signals
Open interest and wallet behaviour provide additional context. Wallets holding between 100 and 1,000 BTC continued to accumulate since mid-July, collectively adding a sizable position. At the same time, Binance Bitcoin open interest fell by about $500 million after the rally, indicating a partial deleveraging among futures traders.
Crypto analyst commentary suggested leverage had been flushed out during the recent volatility. One market participant observed that BTC open interest reset to pre-rally levels, a pattern historically associated with healthier setups that can precede another leg higher once excess leverage is cleared. That said, short-term internal structure can still look bearish even when the broader setup appears constructive.
Technical picture: momentum cooling but buyers still present
Bitcoin’s daily technical indicators point to a consolidation phase after the sharp rebound from mid-September lows near $75,000–$77,000. The Money Flow Index (MFI) sits around 59.35, signalling positive buying pressure but well short of overbought territory. The Know Sure Thing (KST) indicator remains positive but has rolled down from its September peaks, showing that bullish momentum has cooled.
BTC faces a critical resistance band between $86,000 and $87,000, a zone where sellers stepped in during the earlier rally. The recent decline tested support near the $83,000–$84,000 area; a decisive break below $83,000–$83,600 could refocus attention on $80,000–$81,000 as the next meaningful support. Conversely, a clean move back above $86,000 would reopen the path toward the prior high around $87,000.
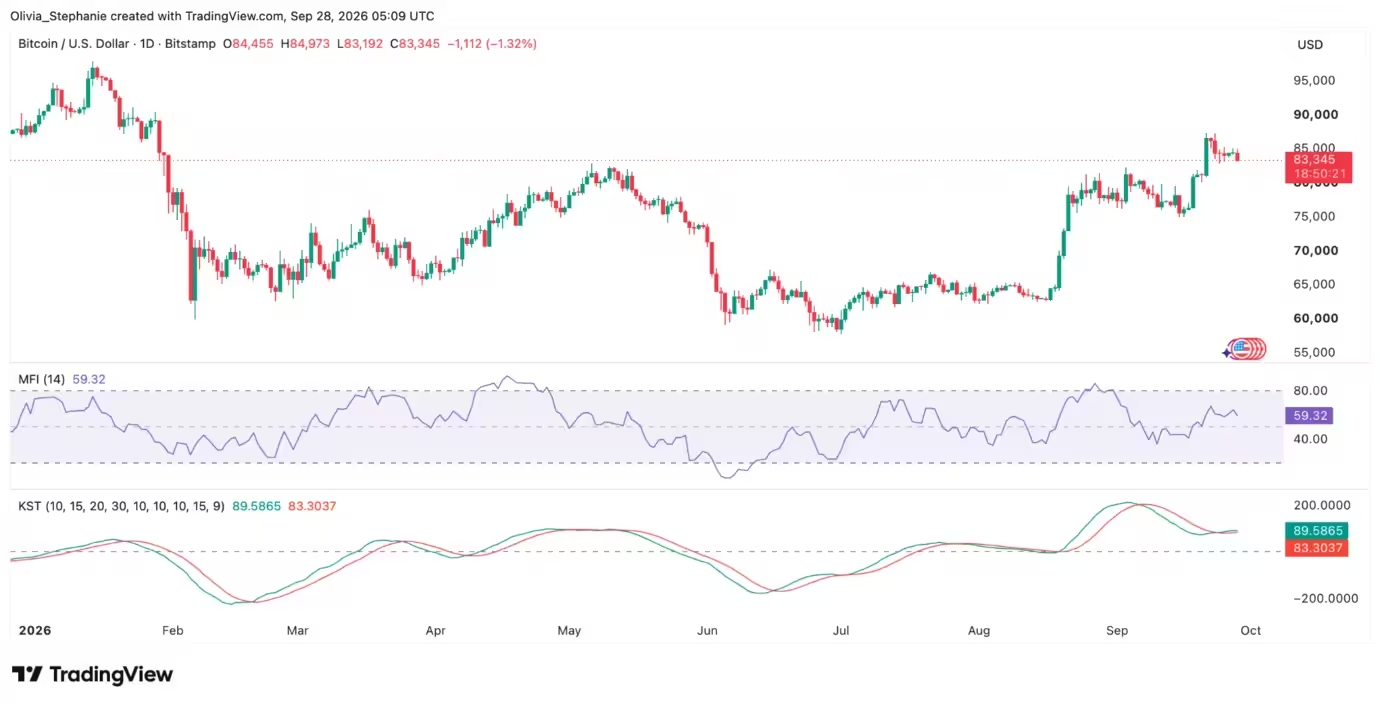
Bitcoin (BTC) price chart

Macro calendar and what traders are watching
U.S. economic data this week could materially influence Treasury yields and Fed rate expectations, which are important drivers for BTC price action. Key releases include the August personal income and spending report — featuring the PCE inflation gauge, the Federal Reserve’s preferred measure — and September employment data. The ISM manufacturing report is also due and will add another read on domestic activity.
Rising Treasury yields have weighed on BTC during the renewed geopolitical risk phase. The 10-year yield climbed above 5% as markets balanced oil-driven inflation concerns, shifting rate expectations and heavier U.S. debt issuance. These macro dynamics complicate the outlook for risk assets, making short-term price swings more likely.
Broader crypto market context
Ethereum and major altcoins felt similar pressure. ETH retraced from above $2,700, while XRP consolidated around $1.50. The weakness was not isolated to Bitcoin and reflected a general reduction in risk appetite across digital assets after a week of sharp gains.
Nevertheless, the broader narrative — continued ETF-led institutional adoption, ongoing on-chain accumulation by mid-size holders, and deleveraging in futures markets — still supports a constructive medium-term outlook for BTC. Many traders view the present weakness as a healthy consolidation that could clear excess leverage and set the stage for a renewed advance if macro conditions stabilise.
Scenarios to watch
- Bull case: Spot ETF flows remain strong and macro data cools inflationary fears, allowing BTC to reclaim $86,000–$87,000 and test new highs. - Bear case: Geopolitical escalation or hotter-than-expected U.S. inflation drives yields higher, pushing BTC below $80,000 and prompting further deleveraging. - Base case: BTC consolidates between $80,000 and $87,000 while ETF inflows and on-chain accumulation continue, setting up for another directional move once macro clarity returns.
Conclusion

Bitcoin’s pullback this week reflects a complex mix of geopolitics, energy markets and macro expectations rather than a fundamental reversal of demand. Institutional flows via spot Bitcoin ETFs remain robust, and on-chain signals show continued accumulation by mid-sized holders. However, rising Treasury yields and heightened risk aversion tied to US–Iran developments keep the market on edge. Traders will be watching U.S. PCE and jobs data closely, along with price action around $83,000 on the downside and $86,000–$87,000 on the upside, to assess the next leg for BTC in the coming weeks.
This analysis is informational and does not constitute financial advice. Investors should consider their risk tolerance and consult qualified professionals before making trading decisions.

Leave a Comment
Comments
No comments yet. Be the first.