

Snapshot: BTC stalls below a heavy sell wall
Bitcoin traded around $84,000 on Sep. 26 after sliding roughly 4% from a weekly peak of $87,363. Short-term order-book data shows concentrated sell pressure above the market, while daily technicals still indicate BTC is comfortably above its 20-period midpoint. Traders and analysts are watching $85,000–$85,800 as the first major barrier that will likely dictate the next directional leg for the world’s largest crypto.
Key figures at a glance
- Binance price at 07:07 UTC: $84,008 (about 3.8% off the weekly high) - First sell zone identified by market watchers: $85,000–$85,800 - 4-hour Supertrend level: $86,435 (now acting as resistance) - Net inflows to U.S. spot Bitcoin ETFs (Sep. 21–25): ~$2.39 billion
Order-book pressure: $85K to $91K looms
Analysts scanning the order book flagged a dense cluster of sell orders from $85,000 up to $91,000. Several independent traders put the immediate hurdle at $85,000–$85,800, with further resistance noted at $88,000 and a particularly large wall around $90,000. These levels reflect standing limit orders that can slow or reverse rallies if they remain intact; clearing them would likely open a clearer path toward fresh highs.
Mister Crypto and other commentators also singled out $85,000 as the ceiling that curtailed Bitcoin’s recent rebounds. If BTC fails to reclaim that area, some technicians expect a deeper retracement toward $81,000–$82,000, a zone that corresponds to prior support and estimated liquidation clusters.
What traders will watch
- A push above $85,800 would put the 4-hour Supertrend and the weekly high back into play. - Rejection at $85,000–$85,800 increases the risk of a pullback into the low $80,000s. - Order books and limit orders can change rapidly; market participants should treat these levels as dynamic.
U.S. spot Bitcoin ETFs: inflows remain supportive
Spot Bitcoin ETFs in the U.S. recorded substantial inflows as BTC approached its weekly high. Across the five trading days from Sep. 21–25, the funds attracted about $2.39 billion in net new money. Farside Investors measured a large Monday intake of $999 million, led by BlackRock’s IBIT ($381.4M), ARK 21Shares’ ARKB ($289.1M) and Fidelity’s FBTC ($238.8M).

Tuesday added roughly $714.7 million in net flows, with IBIT and FBTC again among the largest recipients. Subsequent daily inflows eased but remained positive: $346.9M (Sep. 23), $190.7M (Sep. 24) and $134.5M (Sep. 25). The week’s cumulative figure demonstrates continued institutional demand even as price oscillated, suggesting ETF flows are still a meaningful liquidity backdrop for Bitcoin.
ETF flows and price dynamics
While inflows slowed after the major Monday intake, they remained net-positive throughout the week. That buying helped to underpin Bitcoin even as price traded below the weekly peak, indicating that institutional demand via spot ETFs may continue to provide a structural bid under BTC.
Short-term technicals: Supertrend and oscillator show cooling momentum
On the 4-hour chart, BTC traded near $84,008 with the Supertrend indicator sitting at $86,434.95. Because price moved below the Supertrend after the spike toward $87,000, that indicator now acts as an overhead resistance roughly $2,400 above current levels.
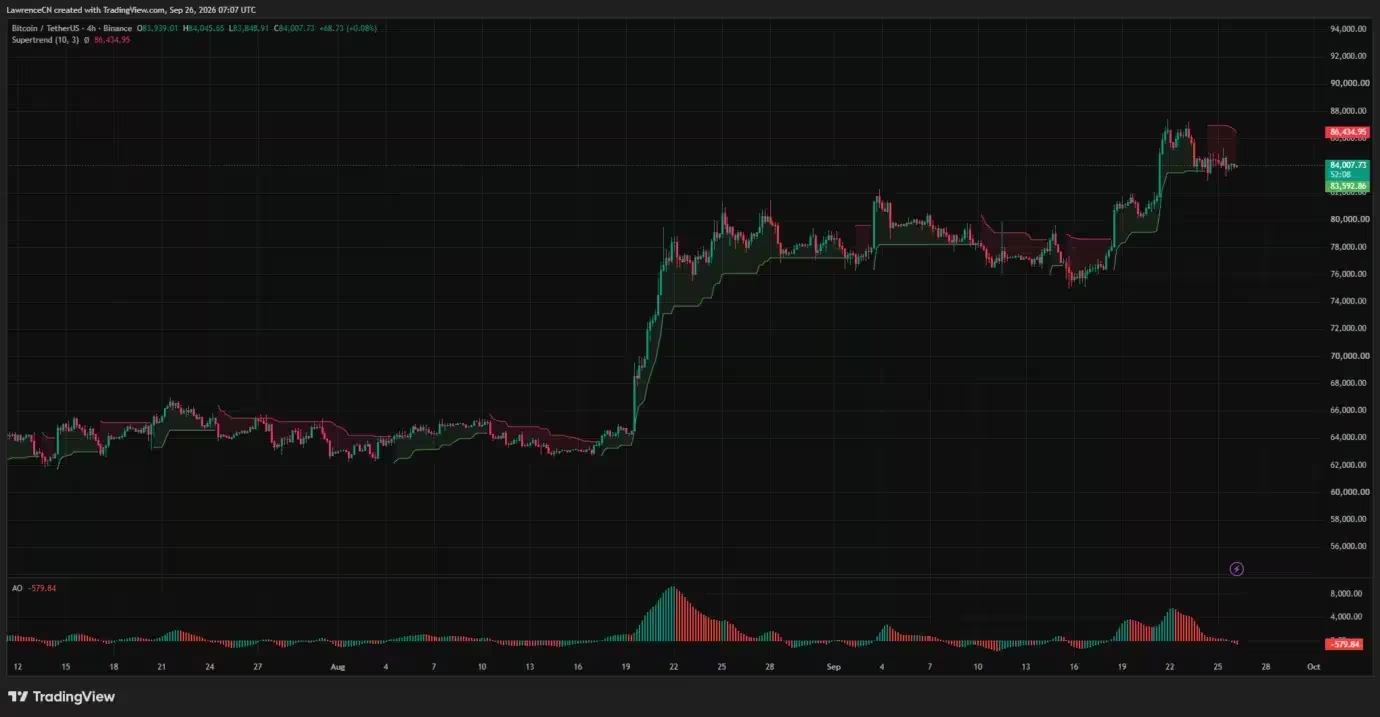
Bitcoin price 4-hour chart — Sep. 26
The 4-hour Awesome Oscillator turned negative, with a reading around −579.84 as the histogram crossed below zero and prior positive bars faded. This shift suggests short-term momentum has cooled, increasing the chance of ranging or downside action unless the oscillator recovers into positive territory.
CoinGlass’ three-day liquidation heatmap places a bright band of elevated estimated liquidations in the $85,000–$85,500 area — overlapping the sell zone identified by order-book analysis. Another pocket of liquidation exposure shows up near $86,500–$87,000. On the downside, notable concentrated exposure appears close to $82,500 and in the $83,000–$83,500 range. These bands show where leveraged positions are concentrated and the levels at which forced liquidations could accelerate moves, but they are not deterministic; they evolve as traders open and close positions.
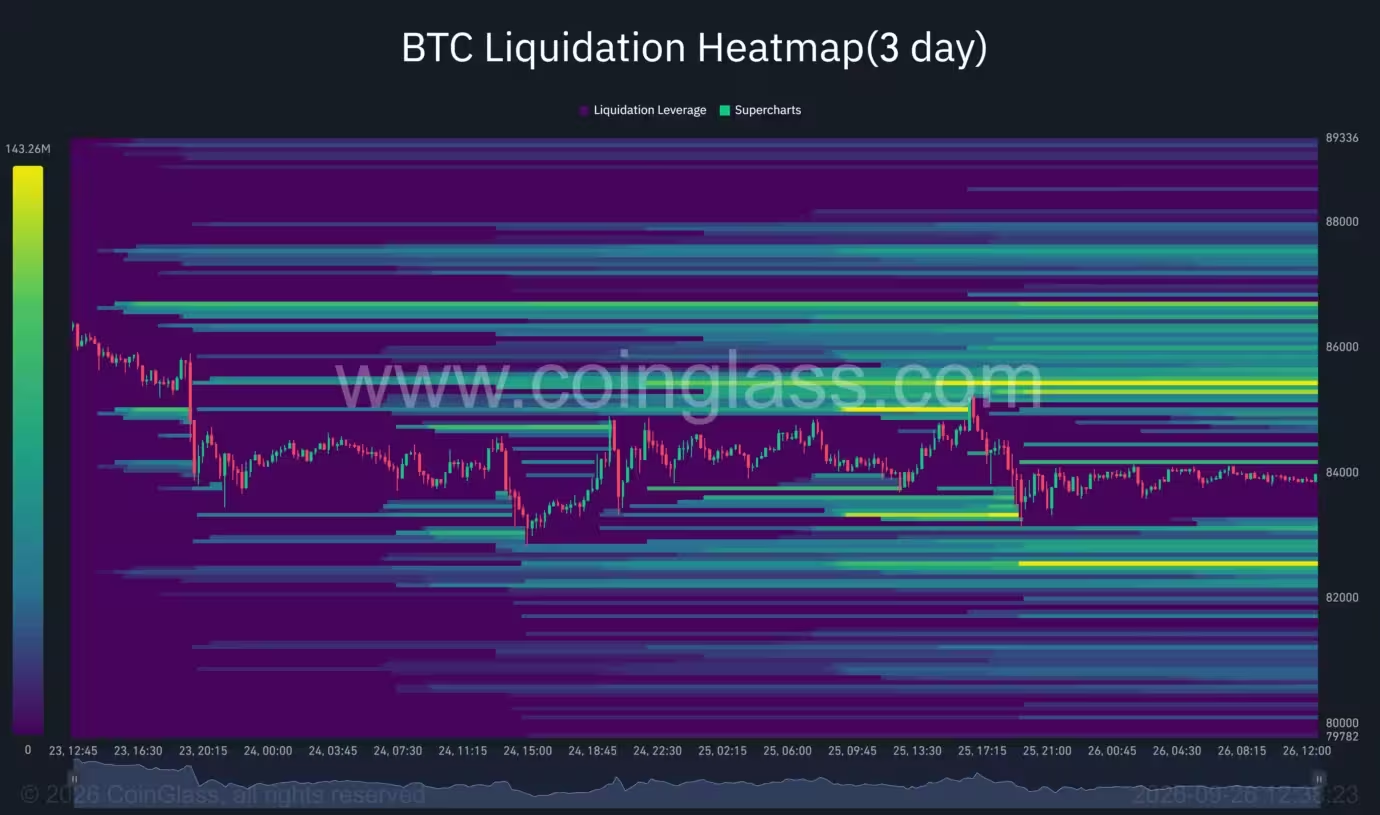
Bitcoin liquidation heatmap

Daily chart: momentum still healthier on a larger timeframe
Daily indicators paint a less bearish picture than intraday tools. The daily relative strength index (RSI) held at roughly 63.94, comfortably above the neutral 50 line and above its moving average near 61.27. That suggests the broader trend retained bullish characteristics despite the short-term pullback.
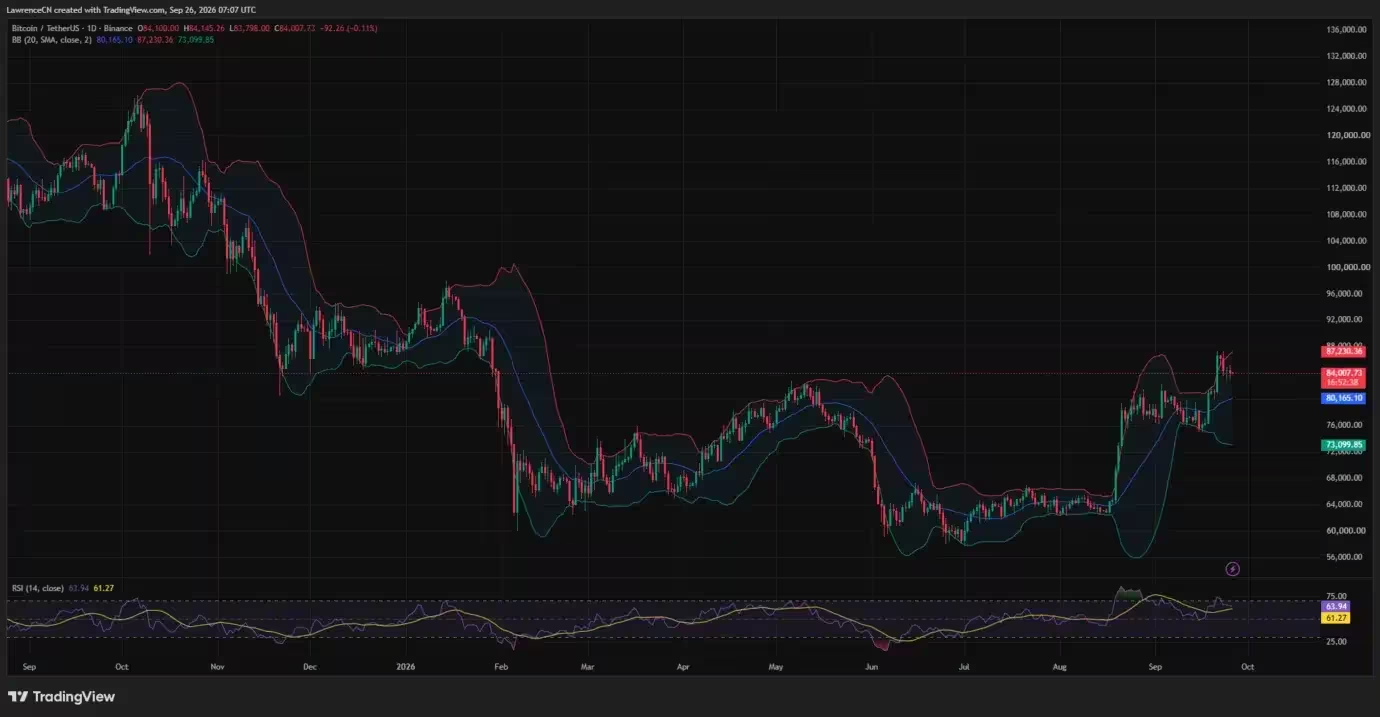
Bitcoin price daily chart — Sep. 26
Bollinger Bands on the daily frame show the 20-period midpoint at about $80,165, placing BTC roughly $3,800 above that level. The upper band sits near $87,230 — close to the weekly high — while the lower band is near $73,100. Bitcoin briefly traded above the upper band during this week’s spike, then moved back inside the bands, leaving the upper band, the Supertrend and the weekly peak as the primary upside barriers.
Immediate technical levels
- Immediate upside sequence: $85,000–$85,800 sell zone → 4-hour Supertrend ~$86,435 → daily upper Bollinger Band ~$87,230 → weekly high $87,363. - Immediate downside support: 4-hour support line near $83,593 → liquidation clusters at $83,000 and $82,500 → $81,000–$82,000 pullback zone → daily Bollinger midpoint near $80,165.
Macro backdrop and market context
U.S. monetary policy remains part of the market’s macro backdrop. The Federal Reserve raised its target rate range by 25 basis points to 3.75%–4% on Sep. 16, a move that preceded this week’s price high and subsequent correction. Despite tighter rates, ETF inflows continued, implying that institutional interest in Bitcoin isn’t solely driven by immediate rate expectations.
Risk management is critical in this environment. With concentrated order-book walls and liquidation bands on both sides of the market, traders using leverage should size positions conservatively and be prepared for rapid swings. For spot traders and investors, the focus will be on whether BTC can clear the near-term $85,000 supply zone — a clean break above it would remove a meaningful obstacle and could catalyze further upside.
What to watch next

- Can Bitcoin reclaim and hold above $85,000? If so, the path toward $87,000 and higher levels becomes more probable. - If BTC loses $85,000 decisively, expect the risk of a pullback into the $81,000–$82,000 range, where several analysts have noted significant support and liquidation clusters. - Monitor spot Bitcoin ETF flow reports for signs of renewed institutional buying or outflows that could shift liquidity dynamics. - Keep an eye on short-term momentum indicators — the Awesome Oscillator and the 4-hour Supertrend — for confirmation of directional bias.
Bottom line: Bitcoin’s near-term trajectory hinges on how it navigates the $85,000–$85,800 sell zone. Daily indicators still favor the bulls, but intraday momentum has weakened. Traders and investors should watch order-book concentration, ETF flows and liquidation heatmaps to anticipate potential sharp moves in either direction.

Leave a Comment
Comments (1)
Is this even true? Big sell wall chatter but ETFs pumped ~$2.4B — trapped liqidity or real bid? If 85k flips could be wild, if not watch 81–82k, hmm