

Pi Network slides under $0.09 as short-term momentum weakens
Pi Network (PI) slipped back beneath the $0.09 mark on September 24 after a recovery attempt stalled near $0.093. At the time of writing PI traded around $0.0878 following an early session open near $0.0881 and an intraday low of $0.08765. The pullback leaves the token trading under its key daily exponential moving averages and signals that bullish momentum has cooled in the near term.
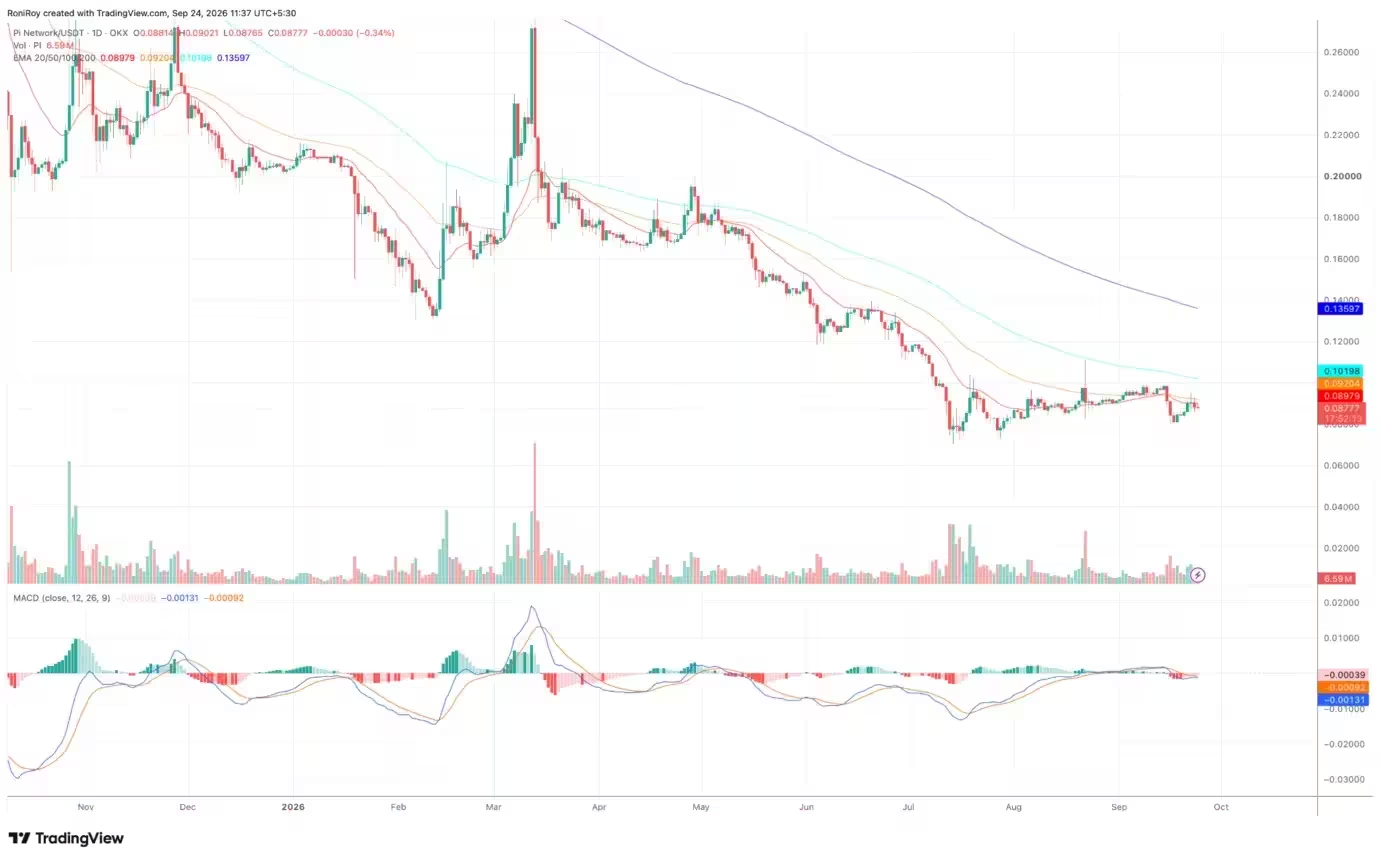
PI/USDT 1-day price chart.
Summary of the technical picture
- PI has fallen below $0.09 after a failed recovery that topped out near $0.093.
- The price sits under the 20, 50, 100 and 200 day EMAs; daily MACD is negative.
- Immediate downside support is $0.085; a drop below that opens $0.080–$0.082.
- To shift the near-term bias, PI must reclaim $0.0898 and then $0.0920.
Why PI is retreating: failed breakout and moving averages
The most immediate driver of the decline is a lack of follow-through from buyers after PI briefly approached $0.09 earlier in the week. The daily chart shows the token remaining below its 20-day, 50-day, 100-day and 200-day exponential moving averages, with the 20-day EMA around $0.08979 and the 50-day EMA near $0.09204. The gap widens further to the 100-day EMA at roughly $0.10198 and the 200-day EMA near $0.13597.
All four averages are aligned in bearish order — shorter-term EMAs below longer-term ones — which often indicates the trend is still biased to the downside until price can convincingly reclaim one or more of those levels. PI spent much of September attempting to build a base under the 20- and 50-day EMAs but hasn’t managed to hold above them.
Momentum indicators: MACD and RSI suggest caution

Daily MACD readings weakened following the rejection near $0.093. The MACD line sits near -0.00131, below the signal line at approximately -0.00092, and the histogram has shifted negative to about -0.00039. Both MACD lines remain under the zero line, which means momentum has not turned bullish.
On the four-hour timeframe, the 14-period relative strength index (RSI) dropped to about 47.27 from readings above 70 during the short-lived recovery on Sept. 22. An RSI under 50 gives sellers a slight edge, although PI is far from oversold — a move below 40 would provide clearer evidence of building selling pressure. The Aroon indicator shows more mixed, slightly less bearish short-term signals: Aroon Up around 71.43% and Aroon Down close to 7.14%, indicating the last meaningful high is still more recent than the last significant low.
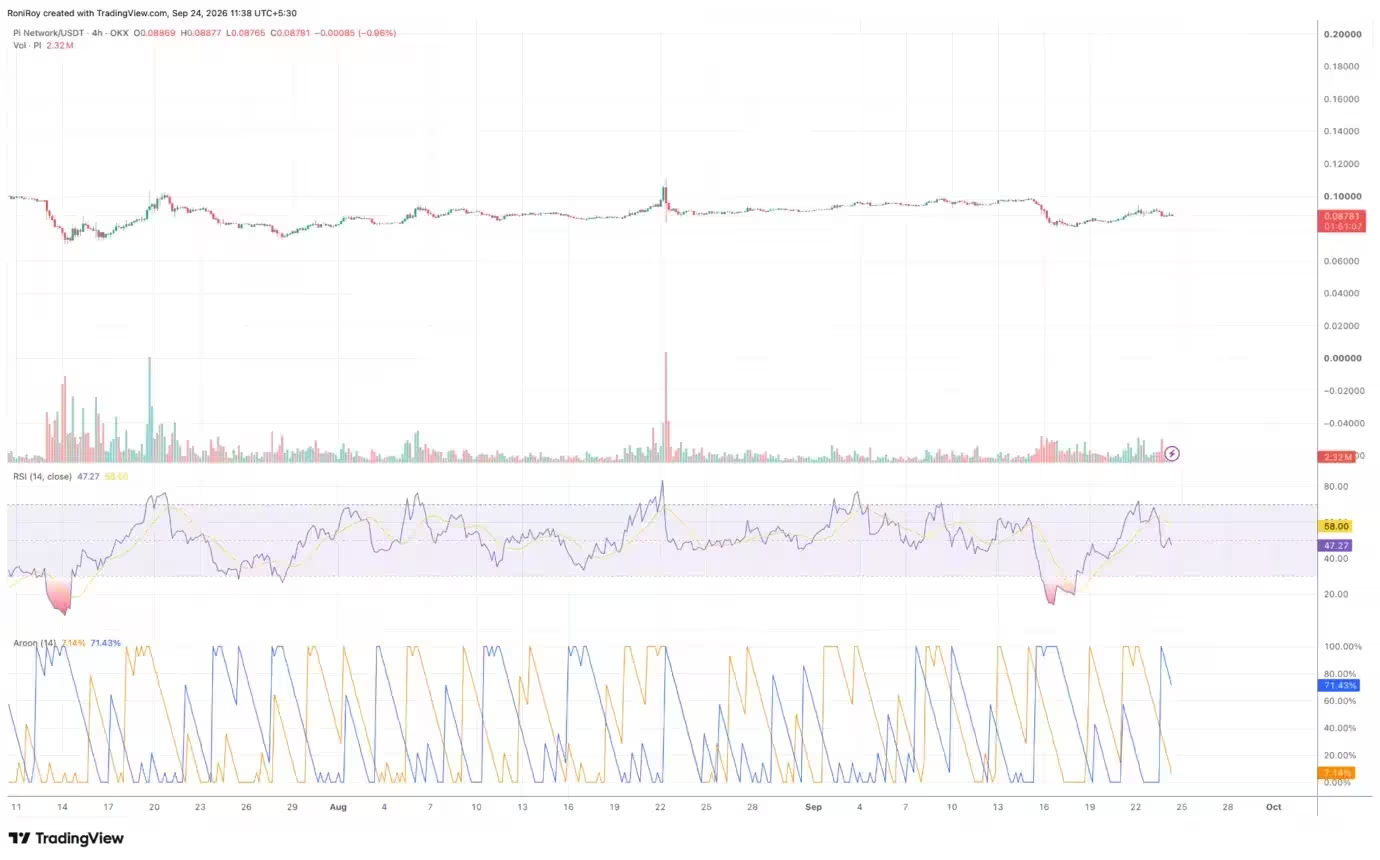
PI/USDT 4-hour price chart.
Network upgrades and user onboarding aren’t yet translating to price gains
Despite technical weakness, on-chain and project-level developments for Pi Network have been constructive. The Pi Core Team updated its duplicate-account checks, reopening KYC for more than 417,000 users who had previously been flagged. In parallel, roughly 497,000 Fast Track wallets remained unable to claim migrated PI because they lacked the gas funds required for the on-chain transactions.
Protocol V27 has progressed to Testnet 2, reportedly processing about 250 transactions per block during testing. Recent infrastructure work related to Protocol V27 includes smart contract authentication, automated market maker (AMM) functionality and RPC improvements. Earlier protocol work around Protocol 26 coincided with a small rally in August, but those technical upgrades have not yet produced a sustained uptick in buyer demand.
Why the market remains cautious

Two structural factors are keeping pressure on the token: liquidity and large-scale token unlocks. Estimates suggest roughly 1.21 billion PI tokens could unlock during 2026, and mainnet migration can convert previously inaccessible balances into transferable tokens. A prior study of the 2026 unlock schedule estimated a release pace of around 6.5 million PI per day. Whether those newly available tokens hit exchanges depends on holder behavior — migration alone does not automatically equal immediate selling — but the potential supply overhang remains a notable risk factor for price discovery.
Key support and resistance levels traders are watching
Immediate technical support lies in the $0.085–$0.087 band, a region PI repeatedly revisited after the mid-September pullback. A decisive break below $0.085 would likely reopen the $0.080–$0.082 range as the next target, and a larger sell-off could push the token toward the July price zone near $0.071–$0.075 visible on daily charts.
On the upside, buyers must first recapture the 20-day EMA near $0.0898 to relieve near-term pressure. The 50-day EMA at roughly $0.0920 forms the next resistance hurdle. If bulls can push through that zone, the $0.096–$0.10 range becomes a meaningful barrier before the 100-day EMA near $0.102 comes into focus.
A successful reclaim of those moving averages with expanding volume would increase the odds of a sustained reversal. Until then, with daily MACD negative and four-hour RSI below 50, downside scenarios remain more likely than a sharp breakout.
Trading implications and risk management
For traders and investors, the current environment suggests a cautious approach. Short-term traders may look for confirmations before entering long positions — for example, a daily close back above $0.0898 with pickup in volume, or a clean reclaim of $0.0920 that holds on follow-through. Conversely, momentum traders betting on further declines could set initial downside targets around $0.085 and then $0.080, with stop-losses keyed above the $0.092 area to limit risk.
Long-term holders should weigh protocol progress and user onboarding improvements against the supply-side risks posed by token unlocks and mainnet migration. If core network upgrades continue and new KYC-cleared users begin transacting, demand could eventually absorb increased supply, but that process may take time.

Scenarios to watch
- Bull case: PI reclaims the 20-day and 50-day EMAs, forces higher-volume buying, and clears $0.096–$0.10. This would open the path toward the 100-day EMA in the $0.102 area.
- Bear case: PI breaks $0.085 on higher volume, triggering a move into $0.080–$0.082 and possibly revisiting July lows near $0.071–$0.075.
- Neutral case: PI continues to consolidate in a range between $0.085 and $0.092 while market participants wait for clarity from mainnet migration and token unlock schedules.
Bottom line
Pi Network’s recent price action shows that positive protocol developments and large KYC re-openings have not yet translated into durable buying pressure. Technical indicators on both daily and four-hour charts favor sellers until PI can clear and hold the 20-day and 50-day EMAs. Traders should monitor the $0.085 support and $0.0898–$0.092 resistance band closely, and consider the broader supply dynamics from planned token unlocks and migration when sizing positions. As always in crypto markets, combine technical signals with on-chain context and disciplined risk management.

Leave a Comment
Comments
No comments yet. Be the first.