

6 Minutes
Bitcoin posts a sharp rebound but faces a key barrier
Bitcoin recovered roughly 6% in 24 hours to trade near 81,300 at the time of writing, climbing from a low below 77,000 and marking its highest level in about two weeks. A short squeeze combined with improving technical momentum helped lift BTC through several intraday resistances, erasing earlier weekly losses and drawing renewed attention from traders and market analysts.
The recovery followed a period of heavy macro and regulatory pressures, including the US Federal Reserve rate hike and the Senate rejection of the CLARITY Act, both of which weighed on crypto sentiment midweek. Yet Bitcoin has found support after reclaiming its True Market Mean near 76,660, triggering more than 250 million in short liquidations as leveraged sellers were forced to buy back positions.
Technical indicators point to bullish short-term structure
The 4-hour technical picture has shifted notably in BTC's favor. The Supertrend flipped from bearish to bullish with the support now sitting near 78,677, preserving a short-term bullish bias while price remains above that level. Momentum indicators such as the Aroon suggest stronger upside pressure; Aroon Up recently read about 85.71% versus Aroon Down at 21.43%, indicating recent higher highs and reduced downside force. However, Aroon Up has eased down from its peak at 100%, so buyers may need further follow-through above recent highs to keep the momentum intact.
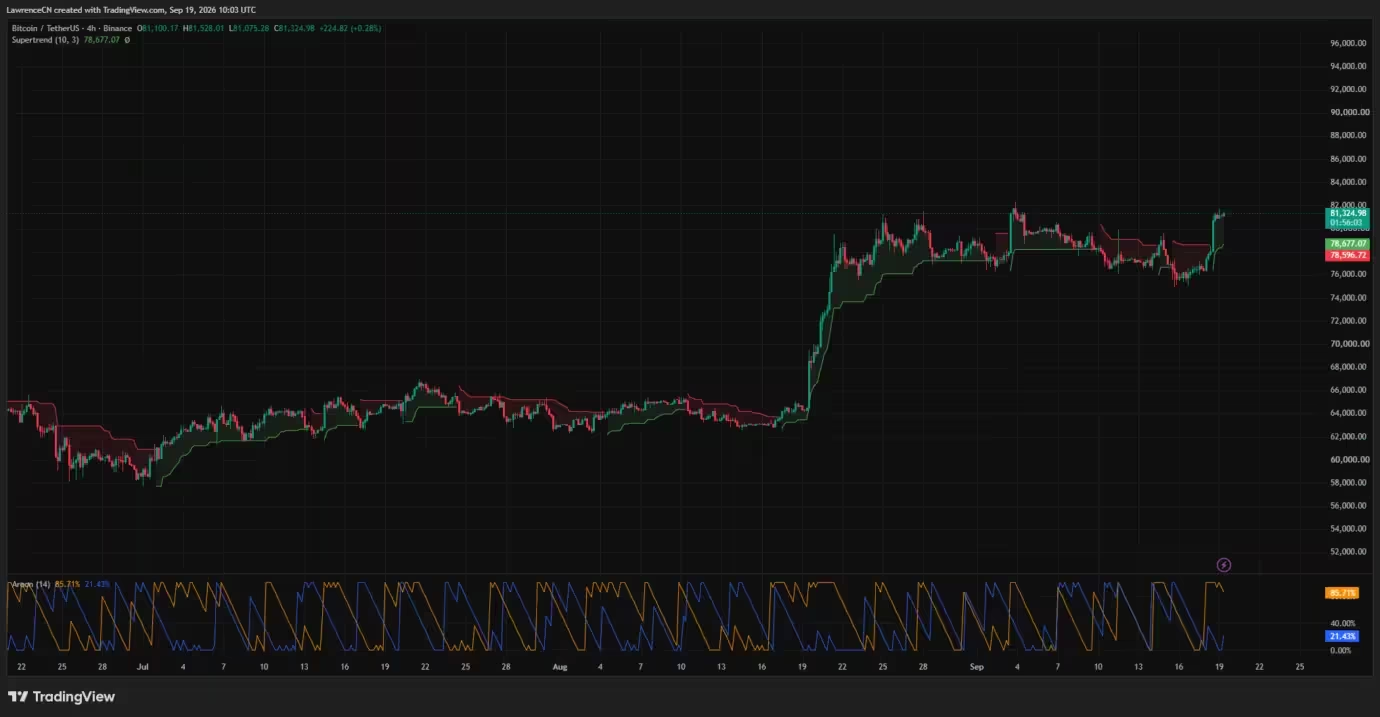
Bitcoin price 4-hour chart — Sep. 19
On the daily timeframe, Bitcoin has climbed above the 20-day Bollinger Bands middle line at 78,346 and is approaching the upper band around 81,745. A daily close above the upper band could support extension toward higher resistances, while rejection at the band might send BTC back toward the middle line. The daily RSI rose to 64.48 from a moving average near 57.25, signaling strong momentum without yet entering classic overbought territory near 70.

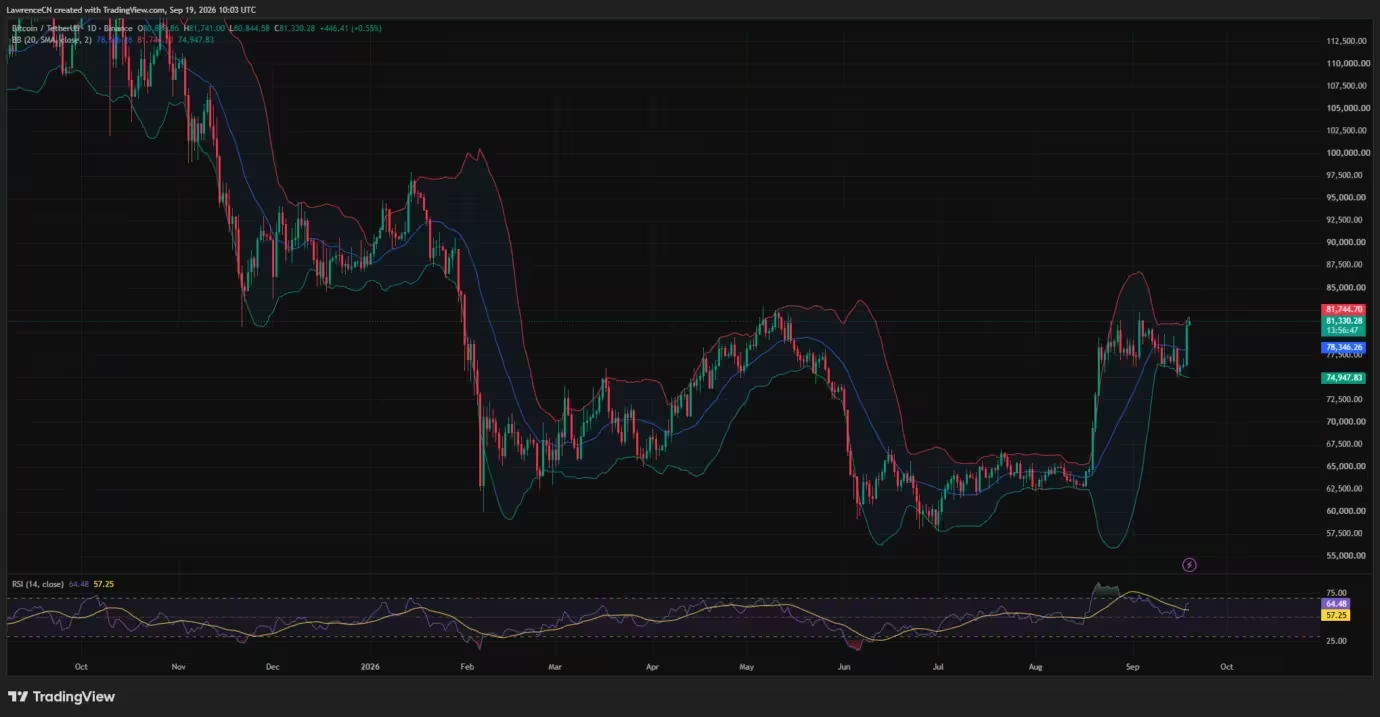
Bitcoin price daily chart — Sep. 19
The mix of a bullish Supertrend, a positive Aroon spread, and an RSI above 60 favors buyers in the near term. Still, BTC is testing a price area that has capped gains repeatedly since late August, meaning the market could see either a breakout or a fresh pullback depending on how derivatives flows behave around key liquidity bands.
Liquidation heatmap highlights resistance around 82,000
Derivatives heatmaps show concentrated leveraged positions clustered just above current prices. CoinGlass data reveals a dense band of shorts between approximately 81,800 and 82,000, a band that could act as immediate resistance if buyers try to extend the rally. A successful breach through 82,000 would expose further liquidity around 82,500 to 83,000, and beyond that, a string of liquidation layers sits near 84,000.
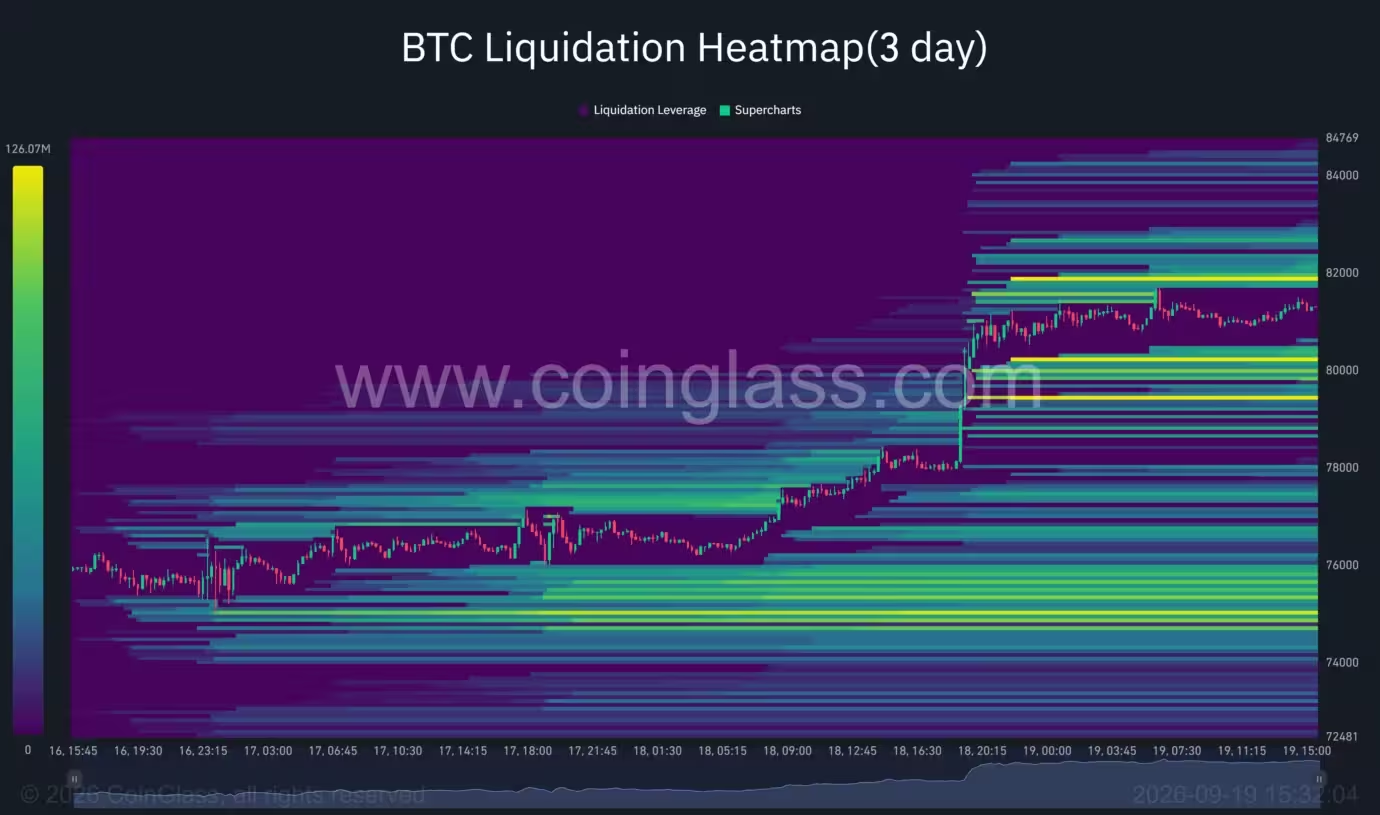
Bitcoin liquidation heatmap
If the short squeeze persists, bulls have a sequence of upside targets available, with 83,000 identified as a critical inflection. Conversely, the largest pools of leverage below the market are clustered near 80,000 and 79,400, levels that Bitcoin could revisit if traders take profits or if profit-taking triggers a pullback. Liquidity overlap between 78,500 and 79,000 also lines up with the 4-hour Supertrend and the daily Bollinger midpoint, making that corridor an important short-term support zone.

A deeper decline would put 75,000 to 76,000 back in focus, where a broad concentration of leveraged positions sits and where the daily lower Bollinger Band is located around 74,948. Heatmaps highlight where leveraged positions may face forced liquidation, but they do not guarantee price will touch those exact levels.
Analysts set 83,000 as the decisive level for a broader bottom
Crypto analysts monitoring the price action flagged 83,000 as the level that could confirm a broader market bottom. One notable analyst noted that Bitcoin looked poised to close above its 50-week moving average and that a sustained break above 83,000 would break the upper boundary of the range that has contained BTC since August. Such confirmation would put 85,000 in the near-term crosshairs and open the door for a more extended recovery.
Other market observers have suggested that holding the 81,000 to 85,000 zone and converting it into support could create a pathway to much higher targets, with some estimating the next major psychological area at roughly 101,000 to 105,000. Those targets remain conditional on a clear resolution above 83,000 or at least a convincing flip of the full 81,000 to 85,000 range into support.
Analysts caution that a failure to sustain gains and a close back below 82,000 would increase the likelihood of another test of 80,000 and the 78,600 support area.
What traders should watch next
- Short liquidation clusters: Traders should monitor order-book liquidity and CoinGlass style heatmaps for areas where forced buying or selling could accelerate moves.
- 83,000 level: A sustained breakout and daily close above 83,000 would be a strong technical signal that the market bottom is forming and could trigger further short-covering.
- Support zones: Key supports to track include the 78,600 to 79,000 corridor, the 76,000 area, and the 75,000 to 76,000 cluster if momentum reverses.
- Macro catalysts: US macro developments, Fed commentary on rates, and ETF flows remain primary external drivers; spot ETF redemptions or inflows can rapidly change price dynamics.
Macro backdrop remains relevant
The rally arrived amid a tough macro week for US crypto investors. The Senate's rejection of the CLARITY Act delayed progress on federal digital-asset market structure, while spot Bitcoin ETFs recorded notable net outflows during the midweek selloff. The Federal Reserve's 25 basis-point rate increase increased the relative appeal of yield-bearing government debt versus risk assets like Bitcoin. At the same time, the Bank of Japan's decision to lift its benchmark rate to 1.25% added another variable for global liquidity.
So far, Bitcoin has absorbed these pressures, but the path ahead is conditional. A confirmed break above 83,000 would likely extend the squeeze toward 85,000 and potentially higher; a failure to hold around 80,000 would shift attention back toward the 78,300 to 78,700 support region. Traders and investors should remain attentive to derivatives metrics, on-chain signals, and macro announcements that can quickly alter the risk-reward balance for BTC positions.

Bottom line
Bitcoin's recent rebound demonstrates renewed buyer interest and short-covering momentum, supported by bullish 4-hour and daily technicals. Yet the market now confronts a stacked liquidity zone around 82,000 to 83,000 that will determine whether this recovery extends into a larger, sustained leg higher or simply marks a short-lived relief rally. For market participants, the decisive line is 83,000, with broader implications for resistance, support, and potential targets in the weeks ahead.

Leave a Comment
Comments (2)
wow didn't expect that squeeze, 250M in short liquidations? wild. If they actually clear 83k imma watch closely, but could fizzle too lol
is 83k really the make-or-break? looks crowded above 82k, feels like stop-hunting. Macro could flip it fast, curious about ETF flows tho.