


Bitcoin dips under $80,000 as US jobs surprise the market
Bitcoin pulled back below the $80,000 mark after a stronger-than-forecast US jobs report pushed traders to price in a higher probability of near-term Fed tightening. BTC traded around $79,600 at the time of writing, retreating from intraday strength near $81,370 and testing lower intraday levels around $78,723. The move came after a rapid multi-week recovery that met stiff resistance in the $82,000–$82,800 zone.
Snapshot: key levels and market moves
Bitcoin's recent price action reflects a market balancing growth expectations, macroeconomic data, and technical resistance. Important short-term levels to watch include: daily resistance near $82,500; 4-hour Supertrend support around $78,190; and concentrated liquidation clusters near $80,000 and the $82,000 area that may accelerate moves in either direction. Market-wide reactions to US jobs data also lifted Treasury yields and the dollar — adding pressure to non-yielding crypto assets.
Price action and recent swing highs
The rally that carried Bitcoin above $82,000 earlier this week marked its best performance since May, but buyers could not sustain momentum through the key resistance band. BTC rose roughly 30% from the August range around $62,500, carving through several prior lower highs on the way up. Two separate attempts to break clear of the $82,000–$82,800 zone were rejected, setting the stage for the pullback following the jobs release.
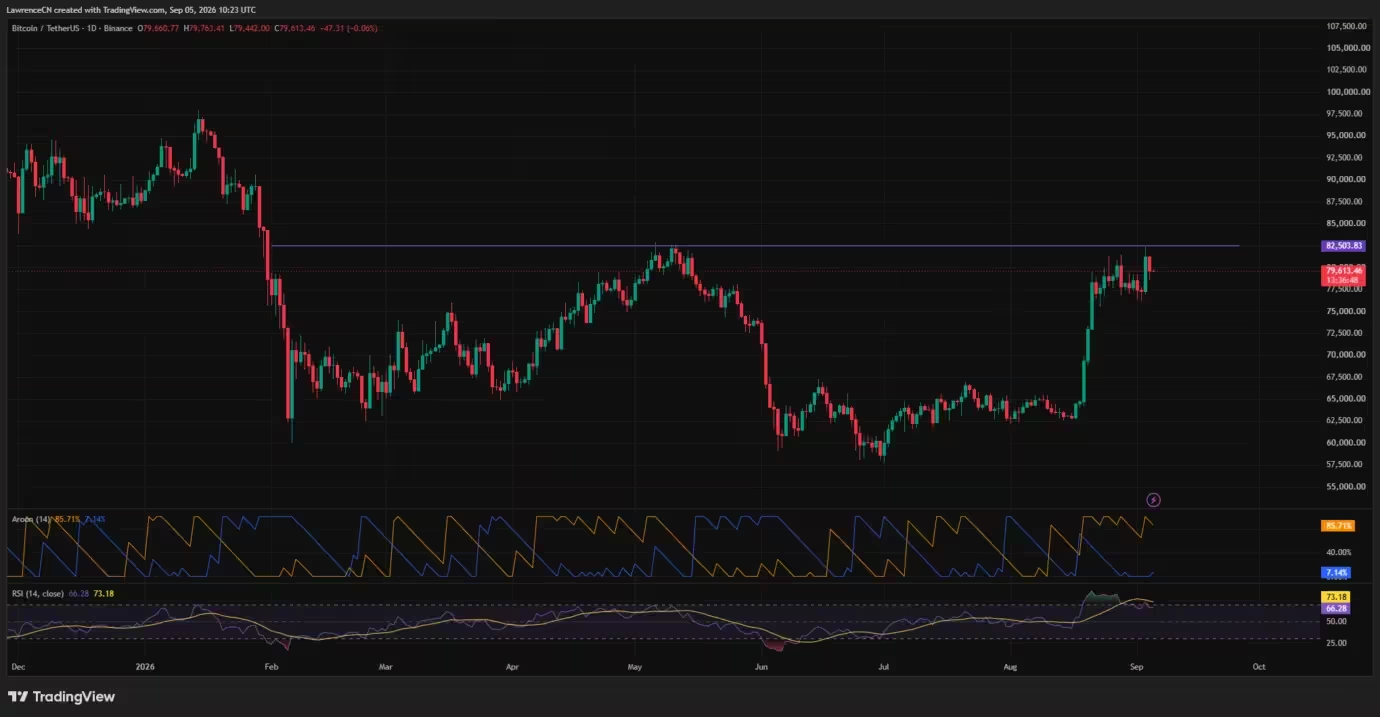
Bitcoin price daily chart — Sep. 5
On the daily timeframe, Bitcoin was trading close to $79,613 after touching a session peak of about $79,763. The asset remained below horizontal resistance sitting near $82,504, a level that also aligns with the May swing high and has proven to be a psychological barrier.
US employment surprise and Fed repricing

The US Bureau of Labor Statistics reported that nonfarm payrolls rose by 162,000 in August, far exceeding the trailing 12-month average of roughly 31,000 per month. The unemployment rate held steady at 4.1%. Job gains were concentrated in food services and drinking places (+59,000) and local government education (+42,000), while the information sector shed 23,000 positions.
Markets quickly adjusted Fed rate expectations: implied odds of a rate increase at the Sept. 15–16 meeting climbed to about 61% from 52% before the report, according to Reuters. In reaction, Citigroup shifted its forecast for the Fed’s next rate cut out to June 2027 from an earlier October 2026 projection. Higher short-term rate expectations pushed Treasury yields and the dollar higher, weighing on yield-insensitive and risk-sensitive assets such as Bitcoin.
Analysts observing crypto markets said the employment report acted as the immediate catalyst for the decline but pointed out that BTC had already been struggling near resistance levels before the print. In other words, fundamentals nudged a technically vulnerable rally into a pullback.
Technical indicators: resistance, support and momentum
Daily momentum gauges show cooling upside pressure. Bitcoin’s daily Relative Strength Index (RSI) stood near 66.28, under the overbought threshold of 70 after briefly moving above that level during the advance. That loss of momentum coincided with price struggling beneath the $82,500 zone.
The Aroon indicator, however, still signals constructive dynamics: Aroon Up reads approximately 85.71% while Aroon Down is around 7.14%, suggesting recent highs remain influential despite the retracement. On shorter timeframes, the technical picture is mixed but has clearly defined pivots.
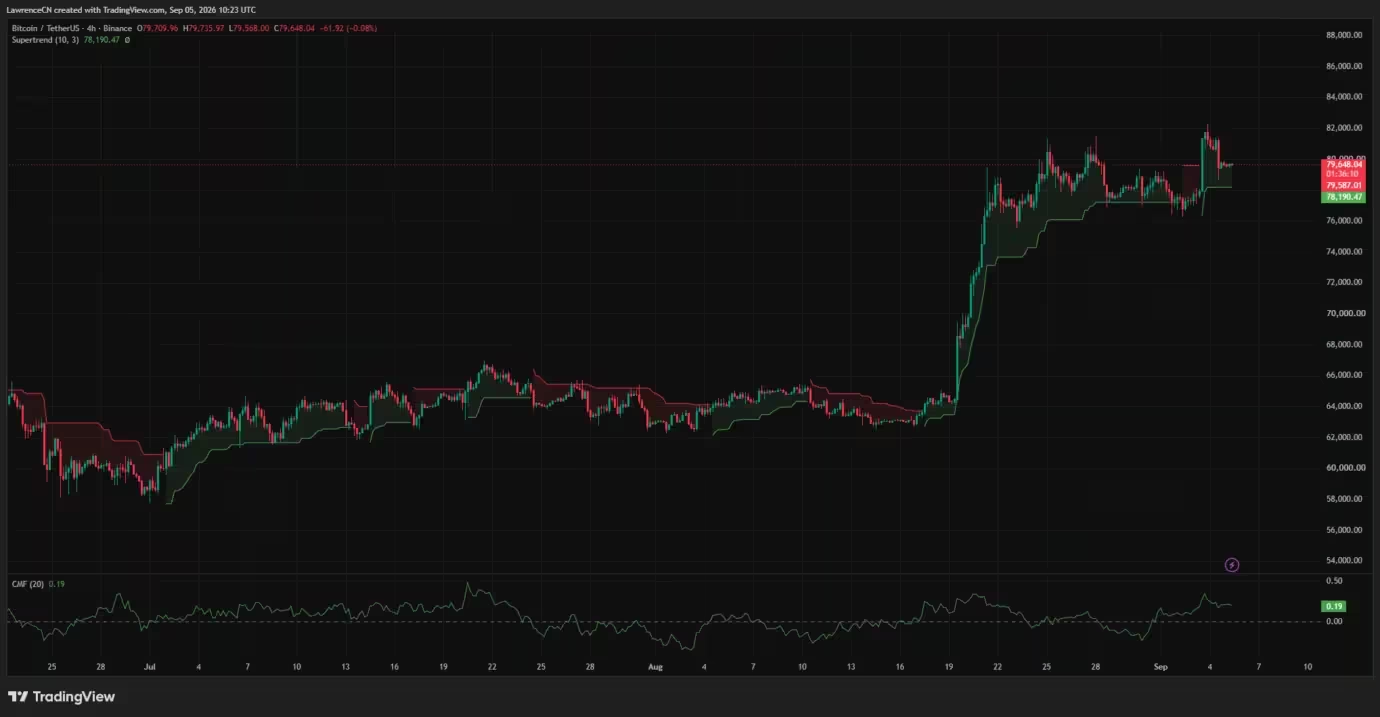
Bitcoin price 4-hour chart — Sep. 5
On the 4-hour chart, BTC was trading above the Supertrend line at roughly $78,190. As long as price holds above that Supertrend level, the indicator retains a bullish bias and makes the $78,000–$78,200 area the first line of technical support. A Chaikin Money Flow reading of about 0.19 on the 4-hour timeframe also points to net buying pressure during the measurement window, though it does not rule out another short-term test of support.
A decisive daily close above $82,504 would weaken the current bearish rejection setup. Reuters’ technical commentary identified broader resistance near $82,793, noting that a confirmed breakout above that band could leave $90,000 and the 2026 peak near $97,867 as visible upside targets. Conversely, a failure to defend the 4-hour Supertrend would shift attention toward ~$77,000, with subsequent supports near $75,700 and $71,800.

Liquidity map and liquidation clusters
The one-week CoinGlass liquidation heatmap reveals dense concentrations of leveraged positions clustered near $80,000 and another band between roughly $81,800 and $82,300. That structure places potential short-liquidation zones just below the daily resistance area, meaning that a push through $80,000 could drag BTC toward the upper cluster and provoke volatile, stop-hunting moves.

Bitcoin liquidation heatmap
On the downside, the largest pool of nearby liquidity sits close to $78,000, with additional clusters between $76,000 and $77,000. If $78,000 breaks, long liquidations could accelerate selling pressure and expose lower liquidity bands. The coexistence of these opposing concentration zones leaves Bitcoin operating between competing liquidation triggers — a setup that often leads to sharp intraday moves when one side gets swept.
Analyst views and the bull-trap risk
Some traders caution that the current structure could still create a bull-trap scenario if upside momentum fails to sustain a breakout through the $82,000–$84,000 invalidation range. One market commentator noted that during this cycle, each time the daily RSI climbed into overbought territory it has been followed by a sizeable correction — a pattern he has observed multiple times.
That analyst argued that a decisive, high-volume close above $82,000–$84,000 would reduce the probability that the recent surge is a false breakout and would lessen the risk of forced deleveraging. Until such confirmation arrives, leveraged buyers remain vulnerable to another rejection that could lead to a larger correction.
What traders should watch next
- US inflation prints: The August Consumer Price Index (CPI), due Sept. 11, is the next major macro data point before the Fed’s Sept. 15–16 policy meeting. A hotter-than-expected CPI would reinforce hawkish Fed expectations; softer inflation could lower hike odds and give BTC another chance to challenge $82,500.
- Key technical levels: Monitor a daily close above $82,504 to validate momentum higher, while a loss of the 4-hour Supertrend near $78,190 would increase downside risk toward $77,000 and lower supports.
- Liquidity bands: Watch liquidation clusters around $80,000, $82,000–$82,300, and the $76,000–$78,000 area. Moves that sweep these levels can produce outsized intraday volatility.
Outlook and scenarios
Near term, Bitcoin faces a binary setup: a successful breakout and follow-through above the $82,500 region could open the path toward $90,000 and beyond, while a failure to hold current support levels could accelerate a correction back toward the mid-$70,000s or lower. Macro forces — particularly US employment and inflation surprises that influence Fed policy expectations — will remain the dominant driver of risk appetite and may amplify moves already primed by clustered liquidations.

For crypto traders and investors, preserving liquidity and managing leverage remain essential given how macro updates can quickly reprice rate expectations and shift capital flows. As always, confirm breakouts with volume and watch how open interest and liquidation heatmaps react to gauge whether moves are sustainable or simply short-term squeezes.
In sum, Bitcoin’s recent retreat below $80,000 reflects a mix of technical resistance at the $82,000 band and macro-driven repricing after a stronger US jobs report. The next major catalysts are inflation data and the Fed meeting; until those events resolve, expect an elevated potential for volatility around the identified support and resistance clusters.
Discussion
Leave a Comment
Comments
No comments yet. Be the first.