
6 Minutes
Bitcoin’s MACD golden cross rekindles bullish hopes
Bitcoin has flashed a classic technical signal that traders say could presage a major rally. On the daily chart, Bitcoin’s moving average convergence/divergence (MACD) line crossed above its signal line — a setup many call a “golden cross” — marking the first time this pattern has appeared since early April. That prior signal preceded a rapid price surge of roughly 40% within a month, and if history repeats, BTC could target roughly $160,000 from current levels.
What happened on the chart
The MACD indicator measures momentum by comparing short-term and long-term simple moving averages (SMAs) and then plotting the difference as the MACD line. Traders typically track a 9-period exponential moving average (EMA) of that MACD line as the signal line. On Sept. 5, the MACD line crossed back above the 9-period EMA signal line on Bitcoin’s daily timeframe — a bullish crossover.
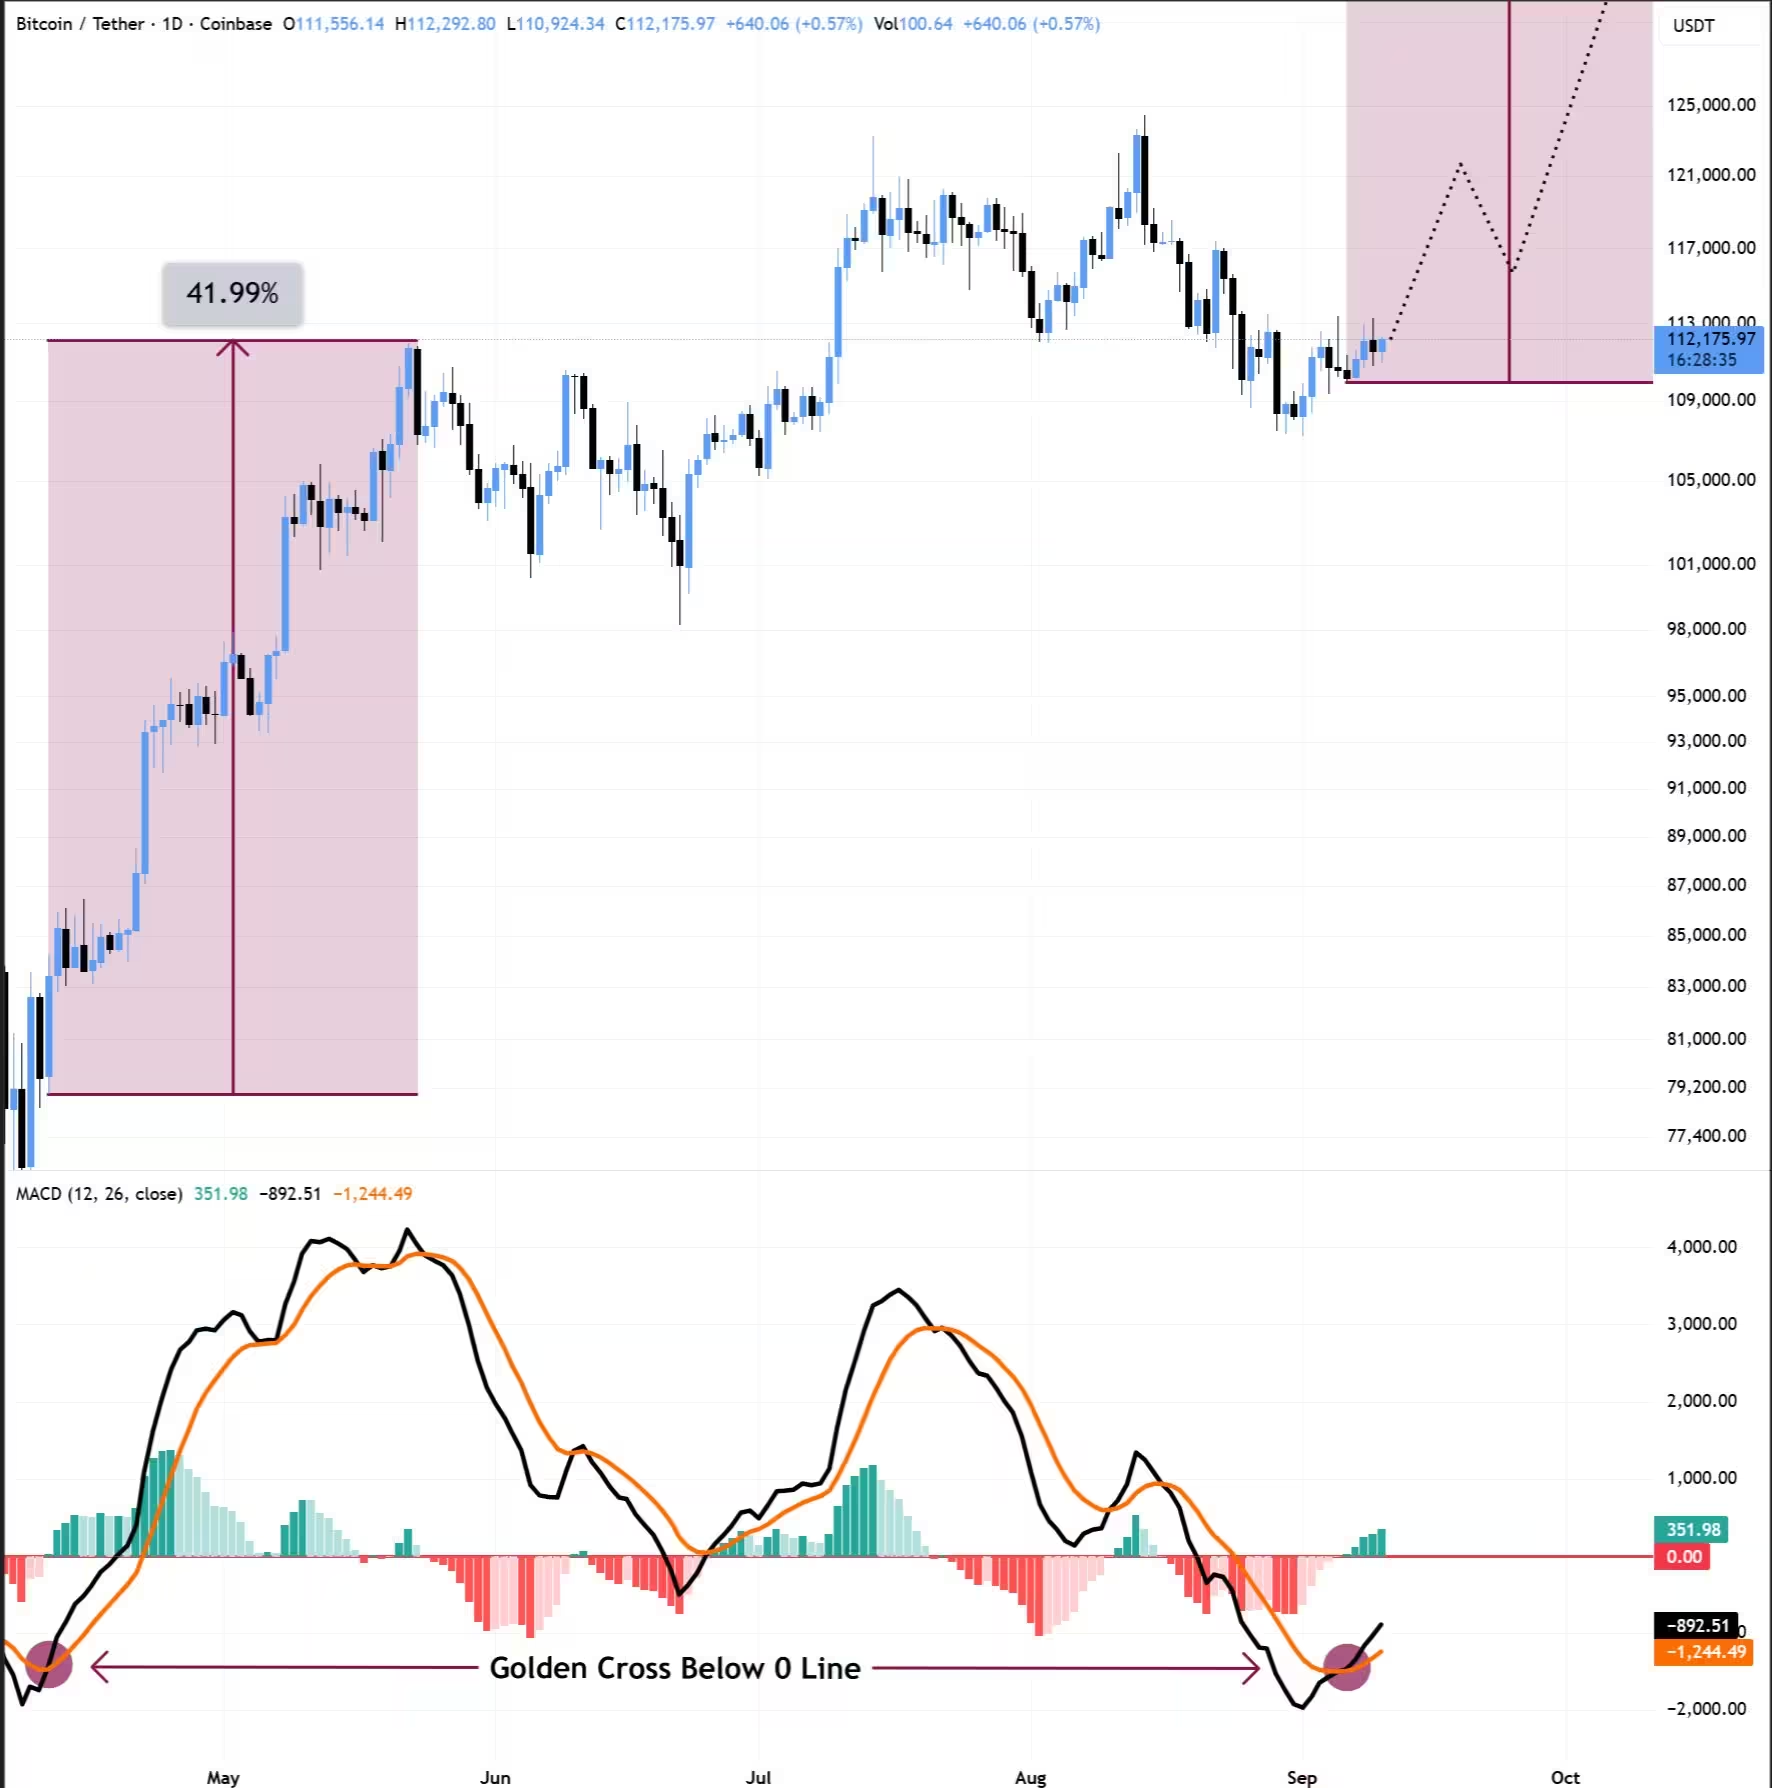
BTC/USDT one-day chart with MACD data. Source: BitBull/X
This recent crossover carries additional significance because it occurred while MACD values were still under zero. Negative MACD readings often reflect local downtrend conditions, so a bullish cross below the zero line can indicate a fresh reversal of momentum rather than a continuation of a mature uptrend. Popular trader BitBull highlighted this nuance, noting that the last time BTC experienced this combination — a bullish MACD cross below zero — momentum quickly strengthened and Bitcoin rallied about 40% in a single month.
Why traders call it a ‘golden cross’
The term “golden cross” is commonly used in technical analysis to describe a bullish crossover between moving averages or momentum lines that suggests shifting momentum in favor of buyers. In the MACD context, the golden cross occurs when the MACD line moves above the signal line. Because MACD aggregates information from SMAs and EMAs, it can flag changes in momentum that precede larger price moves. For many crypto traders, the daily MACD golden cross is a noteworthy buy signal — especially when combined with supportive macro conditions.
From chart signal to price target: the $160K scenario
If Bitcoin repeats the spring’s post-cross performance, a roughly 40% increase from current prices would put BTC in the neighborhood of $160,000. That projection aligns with some market estimates and a broader view that a decisive momentum flip could accelerate investor demand across spot, derivatives, and on-chain flows.
While technical patterns are not guarantees, they help frame probabilistic scenarios. Combining the MACD signal with other on-chain and market indicators can offer a more complete picture. Many traders are already watching derivatives open interest, stablecoin inflows, and exchange balances for confirmation that liquidity is rotating back into risk assets like Bitcoin.
Macroeconomic backdrop: inflation readings and Fed expectations
Technical optimism has gained ground alongside shifting macro data. Recent US inflation dynamics have helped buoy risk assets and safe-haven gold, and markets are increasingly pricing in a return to Federal Reserve policy easing. Traders are eagerly awaiting the August Consumer Price Index (CPI) print; a softer-than-expected CPI could strengthen bets on an imminent rate cut and fuel a broad risk-on reaction that benefits crypto.
Why CPI matters for Bitcoin
Bitcoin’s price is sensitive to expectations about real interest rates and liquidity. Lower inflation — or a CPI outcome that solidifies expectations of Fed loosening — typically reduces bond yields and raises the appeal of return-seeking assets. Popular traders and analysts have suggested that a favorable CPI release could confirm the Fed’s pivot, prompting a rally in equities and crypto markets alike. As trader Jelle summarized on social channels ahead of the CPI release, a print that supports a rate cut “will confirm the rate cut later this month, and markets will react positively.”
What traders should watch next
Technical signals like the MACD golden cross are most useful when combined with confirmation from other market indicators. Here are the primary items traders are monitoring now:
- CPI and other US macro prints: A dovish surprise would likely amplify bullish momentum for Bitcoin.
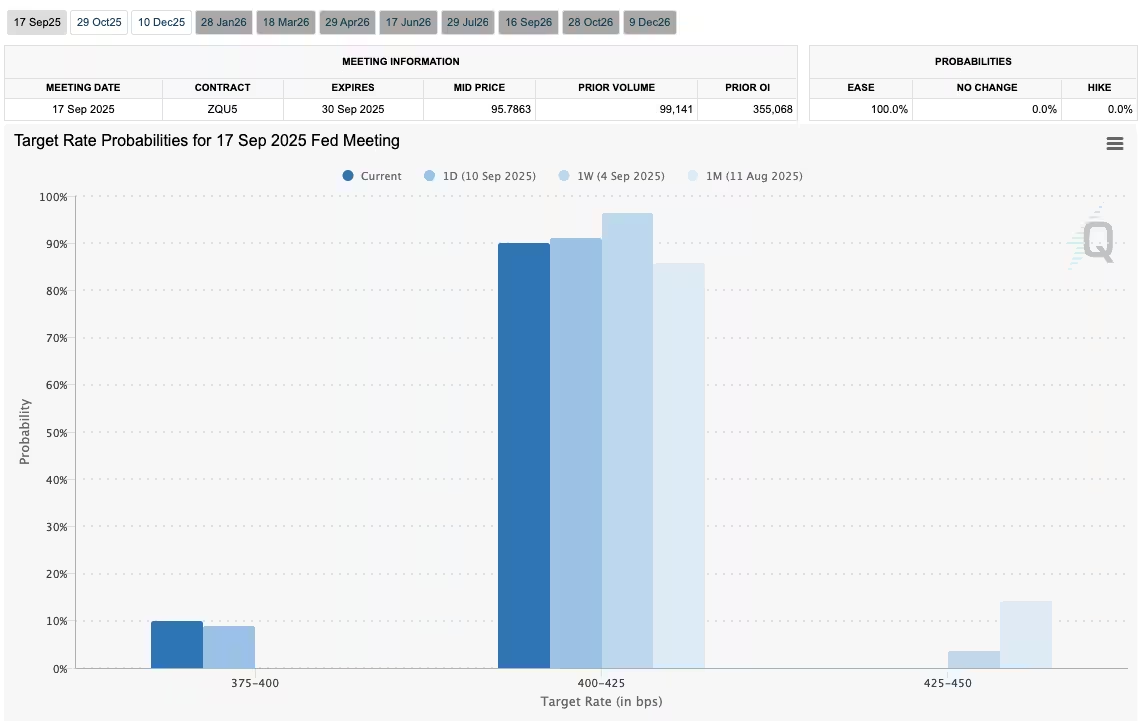
- Fed messaging and CME FedWatch odds: Market-implied probabilities for rate cuts rapidly affect risk appetite.
- On-chain flows: Stablecoin supply dynamics, exchange deposits/withdrawals, and miner selling patterns will influence supply-side pressure.
- Derivatives metrics: Futures funding rates, open interest, and liquidations can both amplify and reverse moves in the near term.
- Volume and breadth: Price moves on weak volume or with narrowing breadth can be less convincing than those supported by broad participation.
Risk management and realism
No technical signal should be traded without risk controls. Golden crosses sometimes produce false positives, and macro surprises can instantly invalidate bullish scenarios. Traders should set clear entry criteria, stop-loss levels, and position sizing rules aligned to their time horizons and risk tolerance. Additionally, the crypto market remains volatile: while the MACD setup points to a potentially strong upside scenario, there is always the possibility of consolidation, rejection at overhead resistance, or macro shocks that slow momentum.
Bottom line
A daily MACD golden cross — particularly one forming below the zero line — has reignited bullish narratives for Bitcoin and renewed interest in a $160,000 price target if momentum mirrors April’s behavior. That technical development arrives at a moment when macro conditions, especially US inflation data and Fed policy expectations, could either validate or overturn the bullish case. For traders and investors, the most prudent path is to combine chart signals with on-chain metrics and macro analysis, manage risk proactively, and watch for confirmation across multiple market indicators before assuming a sustained breakout.
Source: cointelegraph
Leave a Comment