

Why Bitcoin is staying around $84,000 despite strong ETF demand
Bitcoin has been consolidating near $84,000 after failing twice to sustain moves above the $86,000–$87,000 zone. That pause has come even as U.S. spot Bitcoin ETFs continue to draw meaningful inflows, large on-chain wallets accumulate, and major exchanges record net withdrawals. Traders and investors are weighing whether this consolidation is a healthy rest before another leg higher or a sign that momentum is fading without broader confirmation from volume and money-flow indicators.
At a glance: price, flows and on-chain signals
Bitcoin (BTC) trades near $84,400 after rejecting the $87,000 area, with seven-day gains comfortably above 10%.
- U.S. spot Bitcoin ETFs recorded about $191 million in net inflows on September 24, extending a multi-day streak.
- Large entities accumulated roughly 30,269 BTC over a recent 96-hour pullback, based on on-chain analysis.
- Binance showed one of its largest single-day net outflows since 2023, with more than 13,800 BTC withdrawn.
- Momentum indicators such as Bull Bear Power (BBP) remain positive, but Chaikin Money Flow (CMF) sits around neutral, leaving volume confirmation lacking.
CoinGecko’s data placed BTC near $84,403 at the latest check, trading in a 24-hour range roughly between $82,941 and $84,843. The asset has recovered substantially from last week’s low near $75,000, but short-term upside is now testing a resistance cluster that has capped price twice recently.
Technical picture: resistance, support and momentum
The most immediate ceiling is the $86,000–$87,000 band, which has rejected price action on multiple attempts. Analysts previously outlined an $86,700 resistance and an $82,000 support configuration that frames current trading. A sustained break above the $86,700–$87,392 range would reopen room toward new highs, while a decisive failure beneath $82,000 risks returning BTC to the prior $60,000–$80,000 range.
Bull Bear Power readings remain positive near +4,790, indicating bulls still have the edge over bears. However, the BBP histogram has eased from its peak, signaling momentum is cooling compared with the aggressive surge through the $82,000 area. In short, buyers are present but less forceful than during the most recent rally.
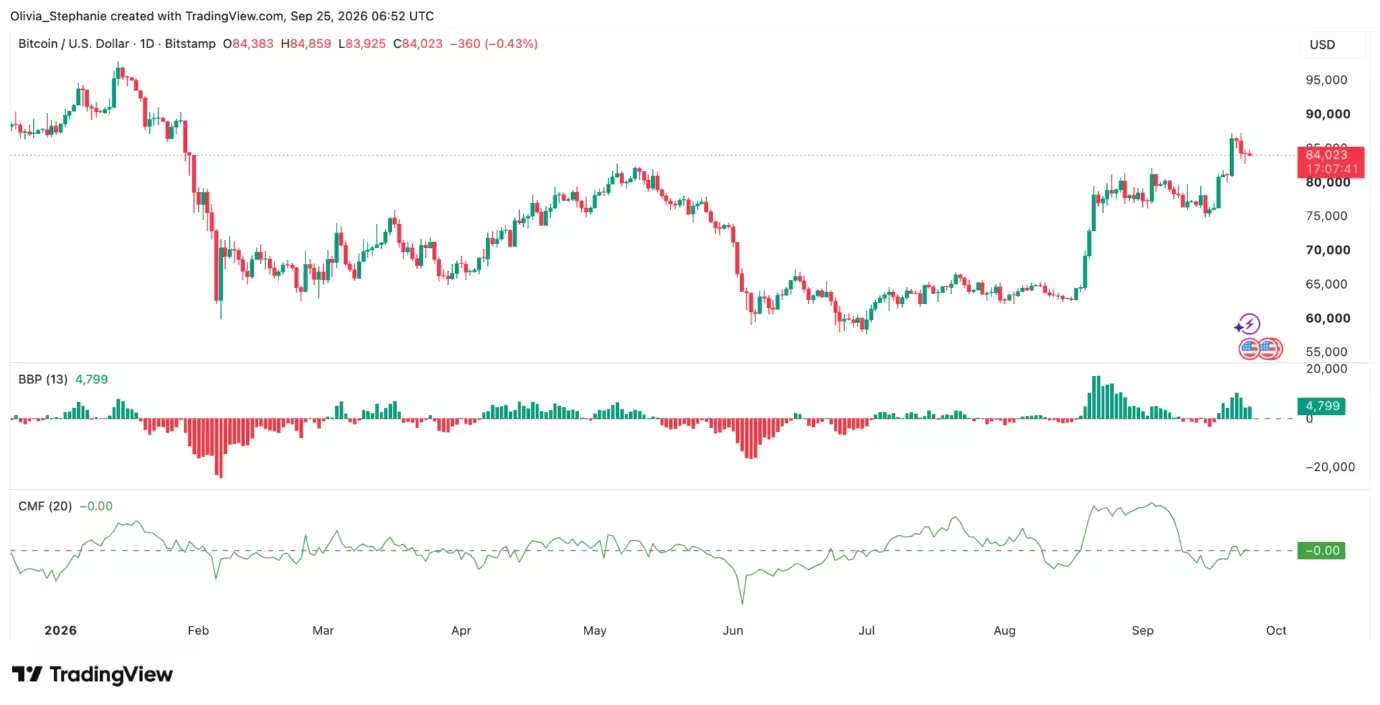
Bitcoin (BTC) price chart
Chaikin Money Flow (CMF), a volume-weighted indicator of capital flows, is currently close to zero after moving up from negative territory. That suggests buying and selling pressure are roughly balanced. A sustained move above zero would corroborate accumulation, while a return below zero would imply weakening capital inflows even as price tries to re-test resistance.

The net takeaway: momentum indicators favor buyers but volume-based confirmation is not yet decisive. That mismatch helps explain why price can rally on ETF demand and on-chain accumulation yet still stall around the mid-$80k zone.
ETF inflows: steady demand but not yet relentless price fuel
U.S. spot Bitcoin ETFs continued to attract capital, drawing approximately $191 million in net inflows on September 24 and extending the inflow streak to six trading sessions, according to SoSoValue. BlackRock’s IBIT led that session with near $163 million, while Fidelity’s FBTC brought in about $12.86 million.
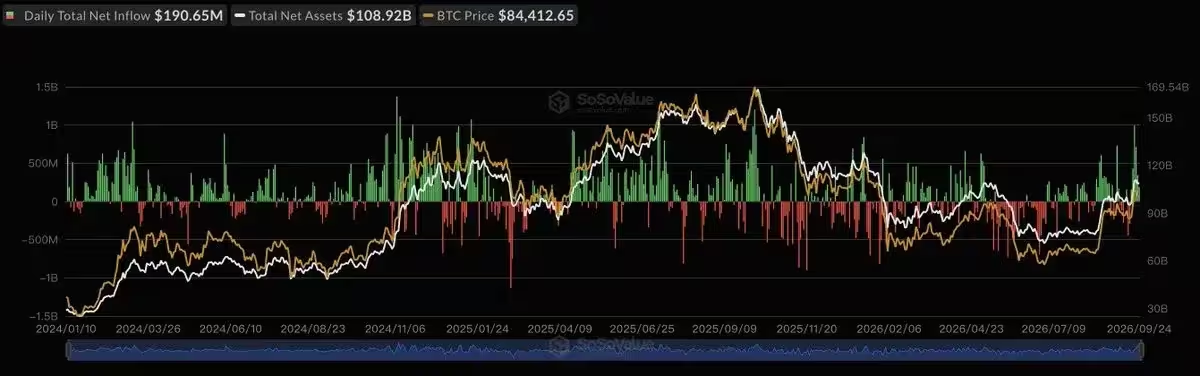
Earlier in the week, flows were even larger: roughly $999 million on September 21, $714.7 million on September 22 and $346.98 million on September 23. Those big days helped drive the initial rebound from the mid-$70,000s. Still, flows briefly reversed around the Federal Reserve’s rate decision, when U.S. funds lost around $746.3 million across September 15–16 before demand returned.
Cumulative U.S. spot ETF inflows now measure in the tens of billions, with net assets for these funds well above $100 billion. ETF demand is a structural bullish input for Bitcoin, increasing spot-supported buying and lowering available circulating supply held on exchanges. But ETF inflows alone do not guarantee continuous upward price movement — liquidity, distribution of purchases, and short positioning dynamics all matter for the immediate path.
Are whales buying the dip? On-chain accumulation tells a story
On-chain analysis shows large-holder accumulation during the recent pullback. Crypto analyst Ali Martinez estimated that large entities accumulated about 30,269 BTC across a 96-hour period while price fell from roughly $87,400 to $82,800. That accumulation equals billions of dollars of buying at prevailing levels and signals confidence from big wallets during the correction.
Santiment’s data also showed incremental accumulation from wallets holding 100–1,000 BTC, which added roughly 113,950 BTC between mid-July and late September. That cohort now controls a larger slice of on-chain supply compared with earlier periods. Keep in mind wallet cohorts may represent multiple addresses controlled by the same investor, exchanges, or custodians — on-chain data reveals flow, not identity.
Large-wallet accumulation reduces sell-side pressure, and when combined with ETF demand, it typically supports higher prices over time. However, accumulation needs to coincide with sustained buying volume and reduced liquidation risk to translate into a sustained breakout.
Exchange withdrawals and liquidity: Binance leads net outflows
Exchange balances, particularly on Binance, have shown notable net outflows. CryptoQuant contributor Darkfost reported more than 13,800 BTC withdrawn from Binance in a single day — the largest daily net outflow since 2023. Over a recent four-day window, Binance’s BTC balance fell from about 705,000 to 685,000 BTC.

Withdrawals from exchanges are often interpreted as accumulation because coins moved off-exchange may enter cold storage, custodial custody, or OTC arrangements. However, withdrawals don't prove that holders won't sell later; coins can also be transferred for collateral, lending, or internal rebalancing.
Another CryptoQuant contributor, Amr Taha, documented similar negative netflows across several exchanges (Binance, Coinbase, Kraken and Bitfinex) totaling roughly $2.52 billion from September 22–24. Those combined withdrawals occurred even as BTC slipped from $87,400 toward $84,000, reinforcing the narrative of off-exchange accumulation but not offering a guarantee against renewed selling.
Key levels and what will confirm a breakout
The principal technical hurdle remains the $86,700–$87,400 cluster. A clean, volume-backed break and hold above that range would likely trigger further upside, aided by renewed ETF buying, short-covering, and momentum chasing. Conversely, failure to hold $82,000 would raise the probability of a retest of lower multi-week support and a return to the $60,000–$80,000 consolidation band.
Traders should watch these confirmation signals:
- Sustained CMF above zero, confirming buying pressure.
- Higher exchange outflows continuing alongside on-chain accumulation.
- Increasing average daily ETF inflows, particularly into large funds like IBIT and FBTC.
- Volatility contraction resolving with a directional breakout above $87,400 or breakdown under $82,000.
Seasonality, macro backdrop and the October calendar
Seasonality enters the discussion as October approaches. Historical monthly returns show October finished higher in 10 of 13 years from 2013–2025, a pattern some traders refer to as “Uptober.” But seasonality is not destiny: October 2025 bucked that pattern, ending lower.
Macro events also matter. The Federal Reserve’s rate decision earlier in September and the political developments around U.S. crypto legislation influenced short-term volatility. The Fed’s next scheduled meeting on October 27–28 could again shift risk sentiment if guidance on inflation and rates changes materially.
Outlook: cautious optimism but confirmation required
Bitcoin’s consolidation near $84,000 reflects a tug-of-war between structural buyers (ETFs and large on-chain wallets) and the need for stronger volume confirmation. ETF inflows and net exchange outflows are bullish building blocks, while neutral money-flow indicators and repeated rejections at $86,000–$87,000 caution traders to wait for clearer confirmation.
For investors focused on the medium term, continued ETF demand and meaningful off-exchange accumulation remain constructive. For short-term traders, a confirmed break above $87,400 with rising CMF and volume would be the clearest signal to target further upside; failure to hold $82,000 would shift the risk profile toward a deeper consolidation.
Watch ETF flow data, exchange balances, CMF and BBP readings, and macro calendar events (Fed meetings, legislative developments) to track whether this pause becomes a springboard or a topping process.

Key takeaways
- Bitcoin’s price is consolidating near $84,000 after two failed attempts above $87,000.
- U.S. spot ETFs continue to attract capital, but volume-based confirmation is still needed.
- Large on-chain wallets accumulated significant BTC during recent weakness, while exchanges recorded hefty withdrawals, notably from Binance.
- Momentum indicators lean bullish but Chaikin Money Flow remains neutral; a breakout will need stronger buying volume and continued off-exchange accumulation.
Overall, Bitcoin’s near-term path depends on whether ETF inflows and whale buying can translate into sustained, volume-backed demand that pushes price past the stubborn $86,700–$87,400 resistance band. Until that confirmation appears, expect choppy action and tight ranges as market participants digest both macro catalysts and on-chain flow dynamics.

Leave a Comment
Comments
No comments yet. Be the first.