

5 Minutes
Ethereum stalls near $2,500 as buyers defend short-term support
Ethereum (ETH) traded around $2,486 on Sep. 9 after an intraday attempt to push above $2,520 failed to gain follow-through. The market remains tightly range-bound as buyers repeatedly support the token near $2,478–$2,485 while sellers cap upside around $2,525–$2,535. Weak momentum indicators and outflows from spot Ethereum exchange-traded funds have reduced institutional demand, keeping a decisive breakout out of reach for now.
Key levels and intraday action
On the day, ETH oscillated in a narrow band between $2,482.50 and $2,523.30. The 4-hour price dipped below the 20-period simple moving average at roughly $2,490, signaling short-term pressure on buyers. At the same time, on-chain and capital-flow signals suggest funds are leaving the market: the Chaikin Money Flow (CMF) on the 4-hour chart reads about -0.09, indicating net capital outflows that make sustained upside moves more difficult.
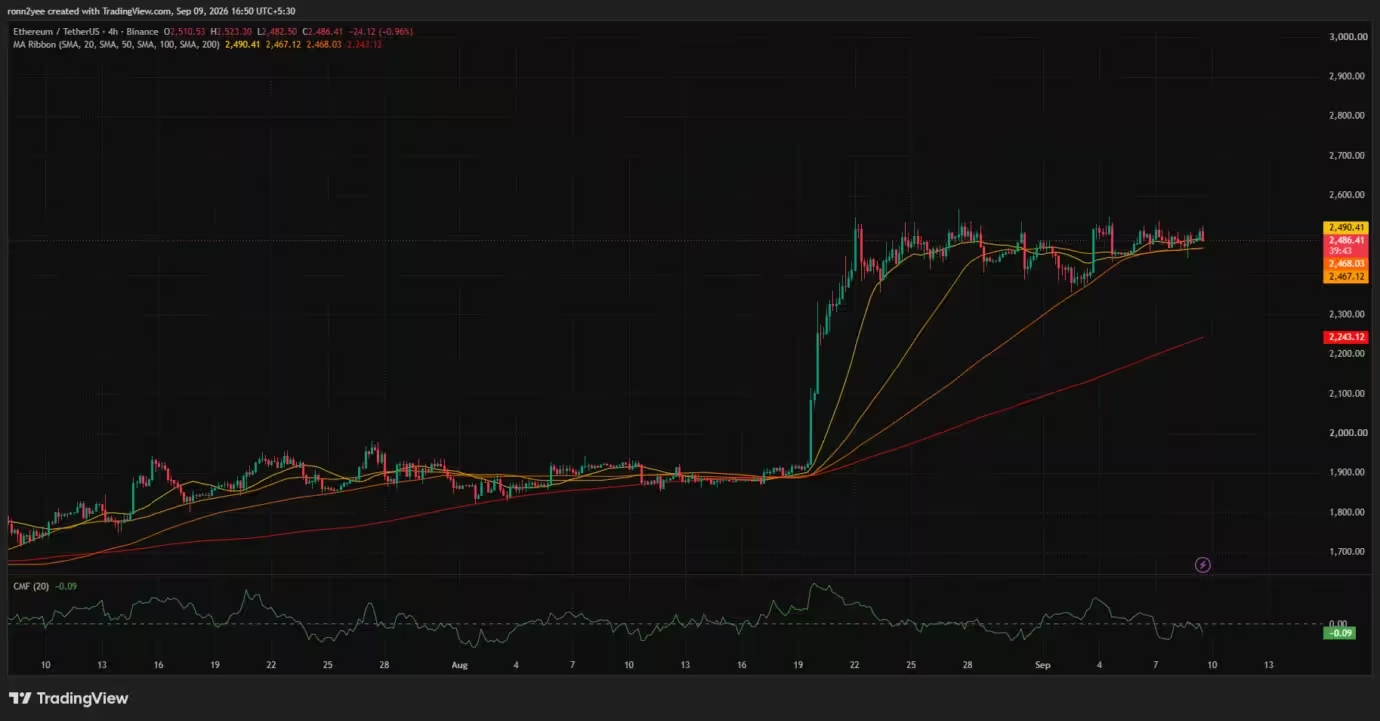
Ethereum price 4-hour chart — Sep. 9
Despite the recent softness, ETH remains perched above its 50-period and 100-period moving averages, clustered near $2,467–$2,468. This moving-average cluster effectively creates a first line of support between $2,465 and $2,470. A breach below that zone would likely open the door to the range floor around $2,435–$2,445, with deeper selling risking a return to the broader $2,350–$2,360 support band where weekly liquidation data shows concentrated downside liquidity.
Daily momentum and resistance tests
On the daily timeframe, Ethereum sits under a critical short-term ceiling: Murrey Math places $2,500 as the 8/8 resistance level. While the Awesome Oscillator remains in positive territory, its contracting histogram bars point to fading bullish momentum since ETH’s sharp August rally. That contraction suggests the market is consolidating rather than launching a fresh leg higher.
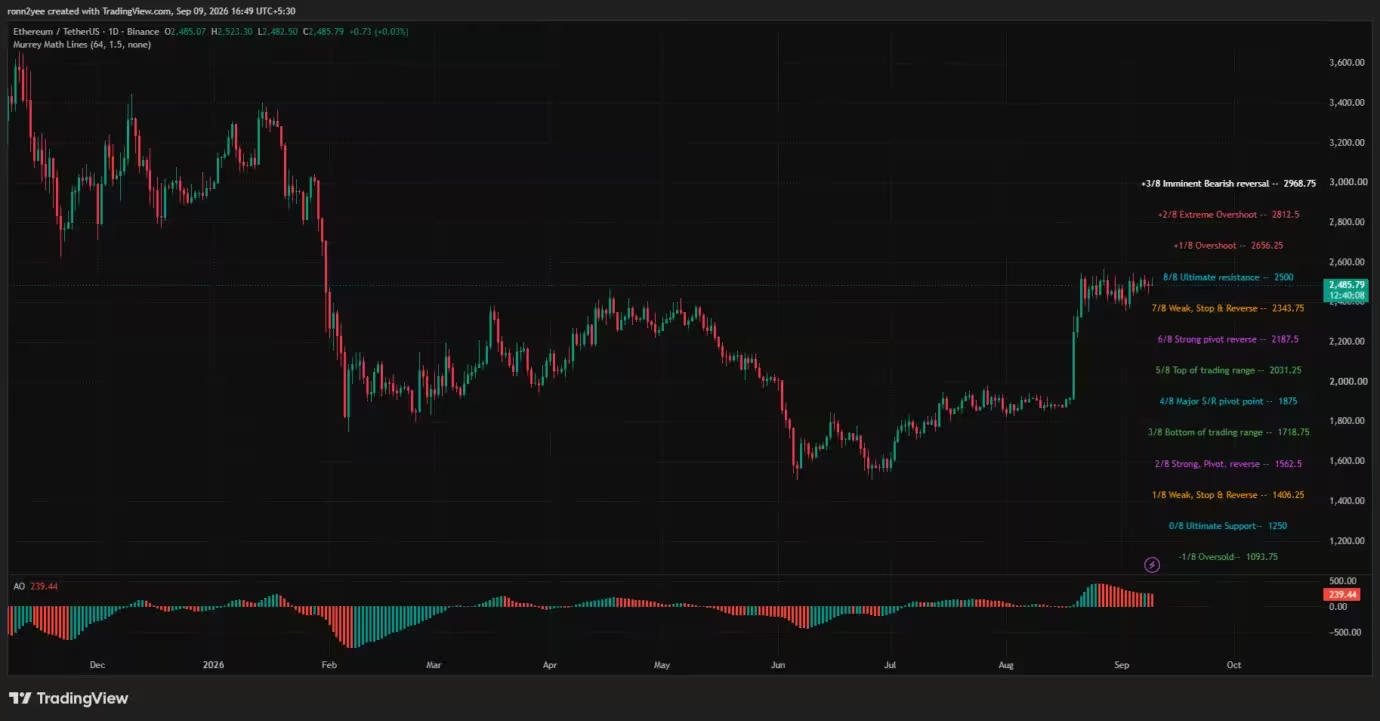
Ethereum price daily chart — Sep. 9
Analysts highlight the importance of a clean daily close above $2,525–$2,535. Such a close would improve the bullish case and could clear the path toward near-term targets at $2,550 and $2,600, and possibly higher if momentum and flows turn favorable. Conversely, failure to hold the $2,478 pivot risks a drop toward $2,435–$2,445 and increases the probability of sweeping the larger liquidity pool near $2,355–$2,365.
Macro and regulatory headwinds shaping ETH flow
Broader macro factors have also curtailed risk appetite. Markets are cautious ahead of the U.S. Federal Reserve’s Sep. 15–16 policy meeting, and elevated energy prices tied to geopolitical tensions have added to inflation concerns. Separately, regulatory uncertainty ahead of a planned U.S. Senate procedural vote on the Clarity Act has encouraged some institutional managers to limit exposure to crypto assets, reducing the likelihood of a quick reacceleration in spot ETF inflows.

Spot ETF outflows and capital flow implications
Recent outflows from spot Ethereum exchange-traded funds have removed a notable source of institutional buying pressure. In combination with negative CMF readings and compressed momentum on the daily charts, these dynamics make a sustainable breakout above the $2,525–$2,535 resistance band more challenging unless liquidity conditions change.
Liquidation heatmap shows clustered risk zones
Leverage and liquidation positioning around current prices could heavily influence the next directional move. CoinGlass’s one-week liquidation heatmap reveals significant clusters of open positions in proximity to ETH’s present levels.
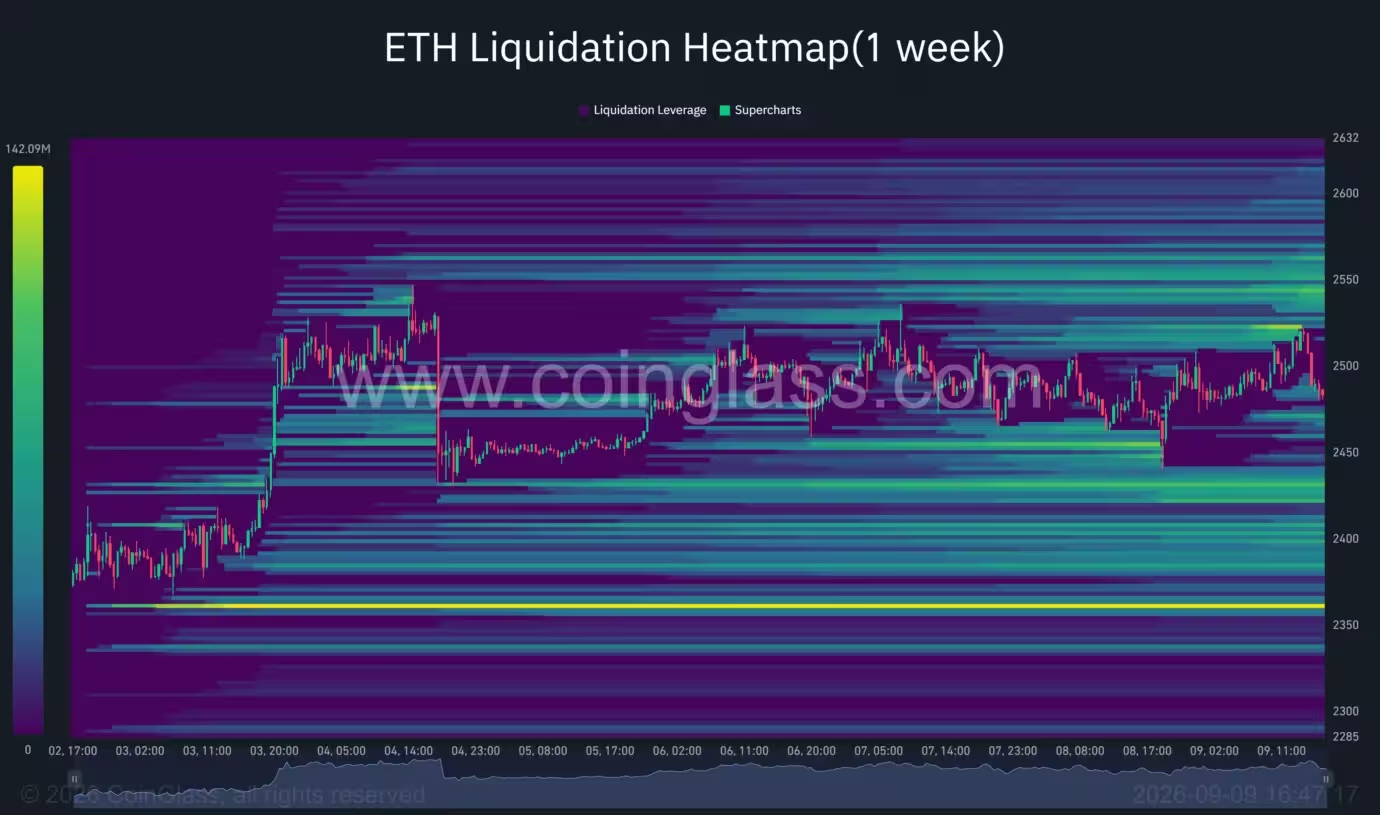
Ethereum liquidation heatmap
Overhead liquidity is concentrated between $2,520 and $2,550, with a further cluster at $2,580–$2,610. An upside push into these ranges would likely force short-covering that could briefly accelerate gains, but those same bands have repeatedly attracted spot selling in recent sessions. On the downside, the first meaningful liquidity band sits around $2,430, with a larger pool down near $2,355–$2,365. If ETH drops below the $2,478 pivot, a slide toward the $2,430 cluster becomes more probable, and a break under that level would raise the chance of a deeper liquidity sweep.
How liquidation clusters could catalyze a move
A sustained reclaim of $2,500 followed by a confirmed daily close above $2,525–$2,535 would likely pull in buyers and could trigger the upper clusters to act as short squeezes, pushing price toward $2,550–$2,600. But with CMF negative and momentum indicators cooling, buyers need both price conviction and improved capital flows to convert these overhead clusters from resistance into support.
Trading outlook: scenarios and risk management
Short-term traders should watch three scenarios closely:
- Bull case: A daily close above $2,535 clears immediate resistance. That would open a measured path to targets at $2,550 and $2,600, with a more extended bullish case toward $3,000 only if momentum and ETF flows accelerate.
- Range-bound case: ETH continues to oscillate between $2,478 and $2,535. This would favor mean-reversion trades that respect support near moving-average clusters ($2,465–$2,470) and resistance near the liquidation bands.
- Bear case: A break below the $2,478 pivot leads to a test of $2,435–$2,445 and potentially a deeper sweep toward $2,355–$2,365 if selling intensifies.
Effective risk management is essential. Traders should set clear stop levels around the identified pivots and size positions to account for sudden liquidity-driven moves into the clusters highlighted by the liquidation heatmap.
Bottom line

Ethereum’s next meaningful directional move depends on whether buyers can reclaim $2,500 and flip the $2,525–$2,535 zone into support. With weakening momentum, negative CMF readings, ETF outflows and macro-regulatory uncertainty, a confirmed daily close above $2,535 is the clearest path to validate a bullish breakout. Otherwise, ETH is vulnerable to another test of short-term support and the broader liquidity bands below.

Leave a Comment
Comments (1)
is this legit? ETF outflows + negative CMF smell like slow bleed, buyers barely defending 2478. Fed meeting could flip it, or just more chop. not comfy.