

Ethereum retreats to $1,875 as $1,900 proves sticky
Ethereum (ETH) pulled back toward $1,875 after sellers once again defended the $1,900 mark, leaving traders focused on the $1,850 support zone and nearby liquidation clusters. Short-term momentum has weakened, while institutional flows via U.S. spot Ethereum ETFs continue to provide measured support. This article breaks down technical levels, liquidation heatmap dynamics, on-chain and ETF flows, and analyst viewpoints to help traders and investors navigate the current range-bound market.
Key takeaways
- ETH traded near $1,875 after failing to hold above the psychological $1,900 resistance.
- Daily RSI sits just under neutral near 49.7; ETH is below its 20-day and 50-day moving averages.
- Liquidity concentrations lie above current prices at $1,925–$1,950 and below at $1,835–$1,860.
- U.S. spot Ethereum ETFs added roughly $245 million in net inflows in the latest reporting week, supporting demand but not yet forcing a breakout.
Price action and short-term technicals
ETH traded in a narrow intraday band, touching an intraday low around $1,869 and a high near $1,891 on the latest session. The repeated rejection around $1,900 has kept rallies constrained, while buyers have so far defended dips toward the mid-$1,800s. That tug-of-war has produced a stalled structure: rebounds lose steam near $1,920 and declines find temporary bids at or just above $1,850.
On the daily chart, the relative strength index (RSI) sits below 50, signaling neutral-to-slightly-bearish momentum. ETH trades under its 20-day simple moving average (SMA) and 50-day SMA, which converge around the $1,880–$1,895 band — the very area that has capped recent gains. The 100-day average near $1,825 remains a medium-term floor, while the 200-day SMA sits near $2,025, underscoring that the broader downtrend from spring highs has yet to reverse.

Ethereum price daily chart — Aug. 14
Liquidation heatmap: where liquidity could accelerate moves
A one-week liquidation heatmap shows multiple liquidity clusters above ETH's current price, with the most significant bands around $1,940–$1,950 and another cluster near $1,925. If Ethereum reclaims $1,900 and pushes into those bands, short positions could be forced to cover, amplifying a faster upside move via short squeezes.

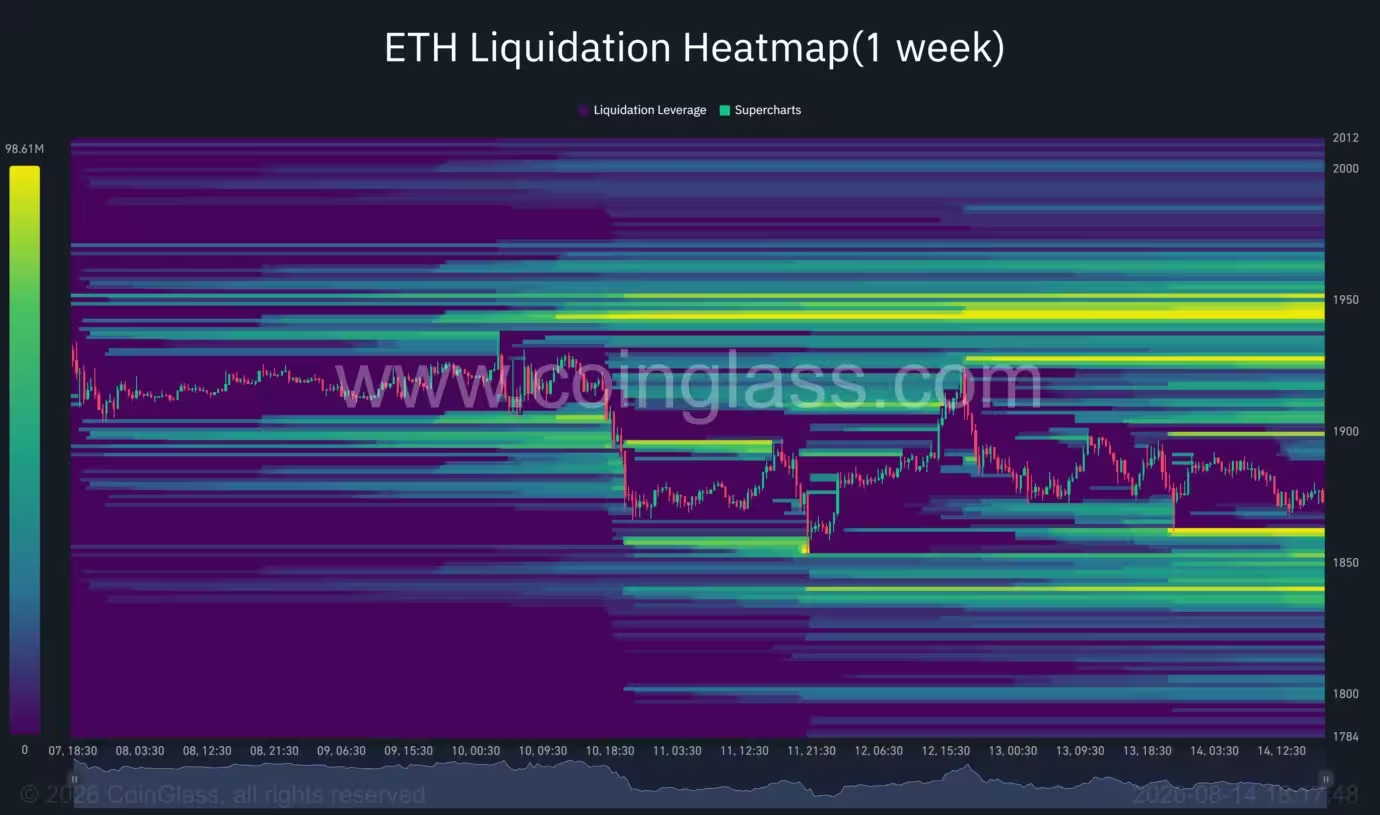
Ethereum liquidation heatmap
Conversely, downside liquidity is active around $1,855–$1,860 and a bigger band near $1,835–$1,845. Should sellers break $1,850 decisively, these lower pools could attract stop orders and push ETH toward the mid-$1,800s, triggering long liquidations and accelerating downward momentum.
The current picture places ETH between competing leveraged pools roughly $20 below and $65–$75 above. That proximity explains why the market has been range-bound: both sides hold potential triggers for sudden, leverage-driven moves.
Intraday structure and momentum indicators
On the 4-hour timeframe, indicators show a mixed picture. Aroon Up is notable relative to Aroon Down, suggesting the recent rebound structure has not fully faded. However, Chaikin Money Flow hovering near zero indicates nearly balanced inflows and outflows with a slight seller bias — consistent with the shallow, indecisive moves observed over the past several sessions.

Ethereum price 4-hour chart — Aug. 14
Traders should watch the immediate resistance band at $1,890–$1,900. A sustained close above $1,900 would open the path toward the $1,925 cluster and the stronger $1,940–$1,950 liquidity zone. Failure to clear $1,900 would leave the upper liquidity bands untouched and increase the risk of another test of $1,850.

Analyst perspectives: must-hold support and BTC correlation
Several analysts have identified $1,850 as a critical support level. Breaking below that mark risks exposing lower targets near $1,700 and, in a more extended sell-off, the late-June recovery low around $1,550. Those downside levels align with the 100-day SMA and other medium-term technical supports.
Crypto analyst Ted Pillows described $1,850 as a "must-hold" level for ETH to preserve its recent gains, listing upside barriers at roughly $1,955, $2,050 and $2,190 should momentum improve. On the flip side, losing $1,850 would increase the probability of a deeper retracement.
MN Trading founder Michaël van de Poppe emphasized Ethereum's relative strength against Bitcoin, noting gains on the ETH/BTC pair approaching the 0.03 region. He cautioned that a Bitcoin sweep lower could create a liquidity flush, but highlighted that altcoin strength versus BTC remains an important backdrop for ETH’s medium-term behavior.
Relative performance versus Bitcoin does not negate dollar-based resistance. Even with ETH gaining on BTC, reclaiming $1,900 and clearing $1,925–$1,950 remains necessary for a more constructive short-term trend against the dollar.
ETF flows and macro context
Institutional demand continues to play a role. U.S. spot Ethereum ETFs reported approximately $245 million in net inflows during the week of Aug. 3–7, marking a fifth consecutive inflow week. BlackRock’s ETF accounted for the largest share, with roughly $203 million, while Fidelity’s offering drew about $24.2 million. Grayscale’s ETHE posted modest outflows in the same period.
These ETF inflows provide a steady channel for institutional and retail capital into ETH, offering regulated exposure and supporting the asset during choppy conditions. However, the weekly inflows were not large enough to overcome the dense sell-side liquidity wiring between $1,900 and $1,950.
On broader markets, mixed macro data has produced uneven risk appetite. Softer U.S. labor data and stable inflation dampened the odds of an imminent Fed rate hike, supporting equity inflows. Still, technology funds saw notable outflows, leaving cryptos exposed to swings in risk appetite and liquidity conditions.

What traders should watch next
- Immediate structure: Watch closes above $1,900 for a potential short squeeze into $1,925–$1,950. Failure there keeps ETH range-bound and vulnerable to retesting $1,850.
- Liquidations: Track liquidation maps and order-book depth near $1,925–$1,950 on the upside and $1,835–$1,860 on the downside for possible leverage-driven moves.
- Moving averages and RSI: A daily close above the 20- and 50-day SMAs would improve short-term bias. Breaks below the 100-day SMA near $1,825 would undermine the June–August recovery.
- ETF flows: Continued spot ETF inflows could accumulate support over time; large weekly inflows would increase the probability of a breakout above the $1,900–$1,950 zone.
Conclusion
Ethereum remains trapped in a tight range as sellers cap rallies at $1,900 and buyers defend the $1,850 area. The liquidation heatmap reveals competing liquidity bands not far from the current price, creating clear short-term triggers: a move above $1,900 could ignite a leveraged short-covering rally, while a decisive break under $1,850 would likely accelerate long liquidations. Institutional ETF inflows support demand but have yet to force a directional breakout. Traders should monitor the $1,850 must-hold level, the $1,900 resistance zone, and ETF flow dynamics to assess the next significant leg for ETH.

Leave a Comment
Comments (2)
Feels stuck. ETFs are nice, but $1,900 keeps rejecting. if that break happens tho, short squeeze incoming, or maybe not lol
Is the $1,900 wall really that strong or just whales playing games? ETFs helping but doesnt feel decisive. watching 1,850 closely...