

Solana’s October setup
Solana (SOL) opened October trading around $121 after posting back-to-back monthly gains. Following a 41.5% surge in August and a further 14.6% advance in September, market attention has shifted to the 124–125 resistance band as the critical technical hurdle for extending the rebound toward the $148 target. Institutional flows, the Alpenglow consensus upgrade and tokenization initiatives add fundamental catalysts that could influence short-term price action.
Share
Current price, momentum and market context
According to CoinGecko, SOL traded near $121.27 on Oct. 4, reflecting a modest 24-hour uptick but a small weekly pullback. Market capitalization sits close to $71.3 billion while daily trading activity is roughly $1.7 billion. Those figures underline that SOL remains firmly inside the large-cap crypto cohort, but near-term volatility and ETF flows will likely steer directional bias.
SOL’s recent advance comes after two strong months. Price data show SOL climbed roughly 41.5% in August and then added another 14.6% in September, with September opening near $103 and closing around $118 after briefly topping $124 late in the month. That extended run-up has left the market testing whether the breakout can sustain or whether a consolidation will follow.
Key technical levels to watch
- Immediate resistance: $124–$125 — the defining range for a confirmed breakout.
- Near-term support: $117, then $116.32 and $112.50 if selling intensifies.
- Bullish target on a clear breakout: $130, $140 and the technical target at $148.

From current levels near $121, a sustained recovery to $148 would imply roughly a 22% move, or about 18% from a $125 starting point. These are attainable moves in crypto markets, but only if buyers can convert intraday strength into persistent daily closes above the resistance region and then hold that area as support.
Technical indicators: RSI, MACD and moving averages
Monthly momentum metrics show mixed but improving readings. The monthly Relative Strength Index (RSI) sits near 50.7, above its moving average and signaling that momentum has recovered from prior weakness without reaching overbought extremes. That neutrality allows room for either a continuation higher or a sideways consolidation.
MACD remains on the negative side for longer-term momentum, with the MACD line below zero and a narrowing histogram. The contraction suggests downside pressure is easing, but the absence of a positive MACD crossover means longer-term bearish momentum has not been fully erased.

On the short-to-intermediate timeframe, the 50-day moving average is near $104 and the 200-day average around $97, both comfortably below the current market price and the key $117 support. If SOL reverses lower, these moving averages and the $109–$117 zones are likely to provide the first meaningful tests for buyers.
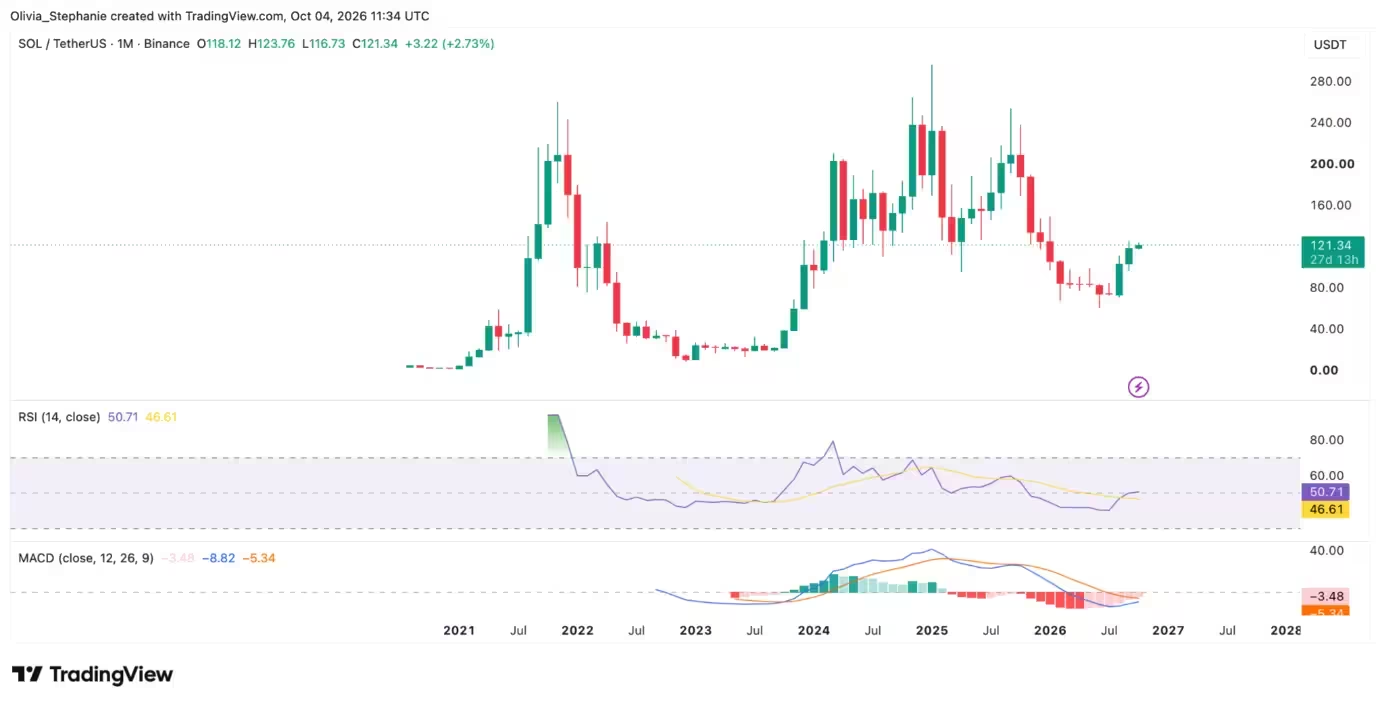
Solana (SOL) price chart
What the charts say: scenarios for October
Traders can reasonably outline three main scenarios for October based on the current technical architecture and fundamental inputs:
- Bullish breakout (124–148): SOL closes above the $124–$125 resistance and holds it as new support. This scenario would re-open the $130–$140 range and potentially target the $148 level flagged by technical setups.
- Sideways consolidation (109–125): Buyers defend the $109–$117 support range, but repeated breakout attempts stall around $124–$125. Price bounces and retests could continue while underlying momentum firmly builds.
- Bearish pullback (95–109): SOL fails to hold $109, opening the path to deeper retracement toward the mid-September low near $96.87 and potentially the next support cluster around $85 if momentum deteriorates further.
The bullish case hinges on closing the weekly and daily candles above that 124–125 band and seeing it flip into support. The neutral scenario would keep SOL range-bound while investors digest excesses after two months of gains. A bearish breakdown below $109 would suggest sellers regain control and more substantial retracement may follow.
Trader commentary and levels
One prominent setup shared by trader Daan Crypto Trades identified $117 as a structural level that needed to hold for SOL to sustainably target $148. His analysis noted that the chart had been respecting key levels with relatively limited drawdowns, making holding positions easier when thresholds remain intact.
$SOL Flipped the $117 resistance. Targeting $148 next if this level holds.
Not the quickest mover, other coins will move faster. But chart has been pretty straight forward and respecting levels well. Drawdowns have been pretty minimal so easier hold. https://t.co/anRSb6tx7O pic.twitter.com/ev36nqiPCd

— Daan Crypto Trades (@DaanCrypto) September 29, 2026
That tweet captures the technical perspective many traders are using: preserve crucial support zones, wait for confirmation above resistance and then add exposure on clean follow-through.
Institutional flows: Solana ETF activity slowed
ETF flows into U.S. Solana products offer an important gauge of institutional demand. Data from Farside Investors showed that U.S. Solana ETFs recorded only about $800,000 in combined net inflows from Sept. 28 through Oct. 2, a sharp deceleration after roughly $188.1 million the prior week. The distribution of those five sessions included small inflows, a sizable outflow day and net-flat performance overall.
Cumulative ETF flows remain meaningful, with total Solana ETF assets near $1.6 billion when seed capital and earlier inflows are included. Bitwise’s BSOL has been a notable recipient of those allocations. However, fresh weekly flows matter more to short-term price dynamics than the cumulative figure: persistent inflows would bolster the bullish narrative, while flat or negative patterns would leave SOL reliant on retail and spot liquidity.
Why flows matter
ETF demand can provide sustained buying pressure during market rallies, especially when spot liquidity is limited. Conversely, when ETF allocation pauses or reverses, prices can become more sensitive to on-chain activity, staking flows and large spot trades. For SOL, a renewed uptick in ETF inflows would be bullish for the breakout case, particularly if accompanied by general market strength.
Alpenglow upgrade: technical catalyst or overhyped target?
A major fundamental event to watch in October is Solana’s Alpenglow upgrade. The Solana Foundation describes Alpenglow as a successor to the TowerBFT consensus system, designed to dramatically reduce block finality targets — from roughly 12.8 seconds down toward a 150-millisecond target under ideal conditions.
Alpenglow’s Votor phase replaces validator vote transactions with direct validator communication and aggregate certificates. The architecture aims to allow a fast-path finality when at least 80% of stake votes in the first round, with fallback mechanisms that rely on 60% thresholds. Developers and validators have been testing Alpenglow on devnet and testnet, but no mainnet activation date has been confirmed. The Foundation warns that finality and real-world throughput will depend on validator distribution, network conditions and whether blocks are finalised via one- or two-round paths.
In other words, the 150-millisecond figure is a target, not a guaranteed live metric on mainnet at launch. Recent performance improvements—target slot times near 250 milliseconds, Transaction V1 and lower storage costs—indicate progress, but market participants should treat Alpenglow as an important, yet inherently uncertain, catalyst.

Market implications of Alpenglow
If Alpenglow deploys successfully on mainnet with measurable finality and throughput gains, it could strengthen Solana’s ecosystem narrative and potentially increase demand for SOL through higher on-chain activity, validator interest and product development. A delayed or problematic rollout, however, could temper enthusiasm and leave price action more dependent on macro and liquidity factors.
Tokenization and institutional use cases
Another potential source of medium-term demand is institutional tokenization initiatives. In mid-September, the U.S. SEC granted conditional, temporary relief enabling qualifying Tokenized Securities Venues to trade tokenized U.S.-listed stocks via permissioned automated market makers and liquidity pools under defined conditions. That order does not mandate any particular blockchain, but it opens regulatory pathways that projects on Solana can pursue.
Solana Foundation initiatives such as Project Harmonia aim to connect institutional distribution networks with tokenized funds and assets on Solana. Project Harmonia’s pilot partners include Allfunds, which had about €1.9 trillion in assets under administration as of June 30. Project applications were open into October with targeted cohorts in late 2026 and early 2027, and the Foundation has highlighted more than $4 billion of institutional real-world assets already hosted onchain in its ecosystem announcements.
While these projects demonstrate institutional interest in Solana’s infrastructure, they do not automatically translate to immediate SOL demand. Tokenized securities and asset tokenization can increase transaction volume, but whether that activity drives meaningful token buying depends on underlying tokenomics, staking economics and whether projects choose to monetize via SOL or alternative rails.
Putting it together: practical trading and investment considerations
For traders and investors, the next moves for SOL should be viewed through a mix of technical thresholds, ETF flow dynamics and fundamental catalysts.
- Traders: watch for daily and weekly closes above $124–$125 before adding sizable long exposure. Maintain disciplined stops below $117 support if the breakout fails, and consider partial scaling into positions on confirmed follow-through.
- Investors: monitor Alpenglow progress and institutional tokenization announcements. Successful network upgrades and growing institutional usage can bolster medium-term prospects for SOL, but investors should assess timing risk and the possibility of delayed upgrades or slower-than-expected adoption.
- Risk management: given SOL’s recent run, volatility can accelerate quickly. Use position sizing and clear stop levels tied to technical support areas to manage downside risk.
What could change the outlook?
- Positive catalysts: confirmed mainnet activation of Alpenglow with measurable performance gains; consistent ETF inflows; large-scale tokenization partnerships moving to production.
- Negative catalysts: failed or delayed upgrade activation, persistent net ETF outflows, macro weakness or major on-chain incidents that crack confidence in Solana’s performance.
Conclusion: a conditional bullish path
October’s price trajectory for SOL is conditional. The 124–125 band is the defining technical zone: a daily close and follow-through above that region would open the path toward $130–$148, while failure to hold the mid-$100 support cluster could prompt a deeper retracement to the $95–$109 area. Institutional flows have slowed this week, making short-term price action more sensitive to technical confirmations and spot demand.
Fundamentally, Alpenglow and tokenization projects provide meaningful catalysts but also carry execution risk. Traders should prioritize confirmation and risk controls; investors should focus on execution milestones and longer-term adoption signals.

As always in crypto markets, watch liquidity, maintain disciplined risk management and adapt to new information as upgrades, ETF flows and on-chain metrics evolve.

Leave a Comment
Comments
No comments yet. Be the first.