

Bitcoin hovers near $84K as momentum cools
Bitcoin traded around $84,575 on Oct. 3, down roughly 1.7% in 24 hours and up about 0.8% over seven days, according to CoinGecko. Daily volume remained elevated near $37.3 billion while market capitalization stayed close to $1.7 trillion. After failing to sustain a push above $87,000, BTC pulled back toward key intraday support without triggering a decisive trend reversal. Traders and derivatives desks are watching Bollinger Bands, Fibonacci retracements, liquidation clusters, and ETF flows for clues about the next directional move.
Price action and immediate technicals
TradingView data from Binance shows the most recent high near $87,220 before a retreat into the mid-$84,000 range. The daily Fibonacci retracement measured from the high around $126,294 to the low near $57,877 places the 61.8% level at $84,012, which now sits almost exactly at current price levels and acts as a meaningful reference for bulls and bears alike. The gap above remains stacked with resistance formed during September highs in the $86,000 to $87,000 band.
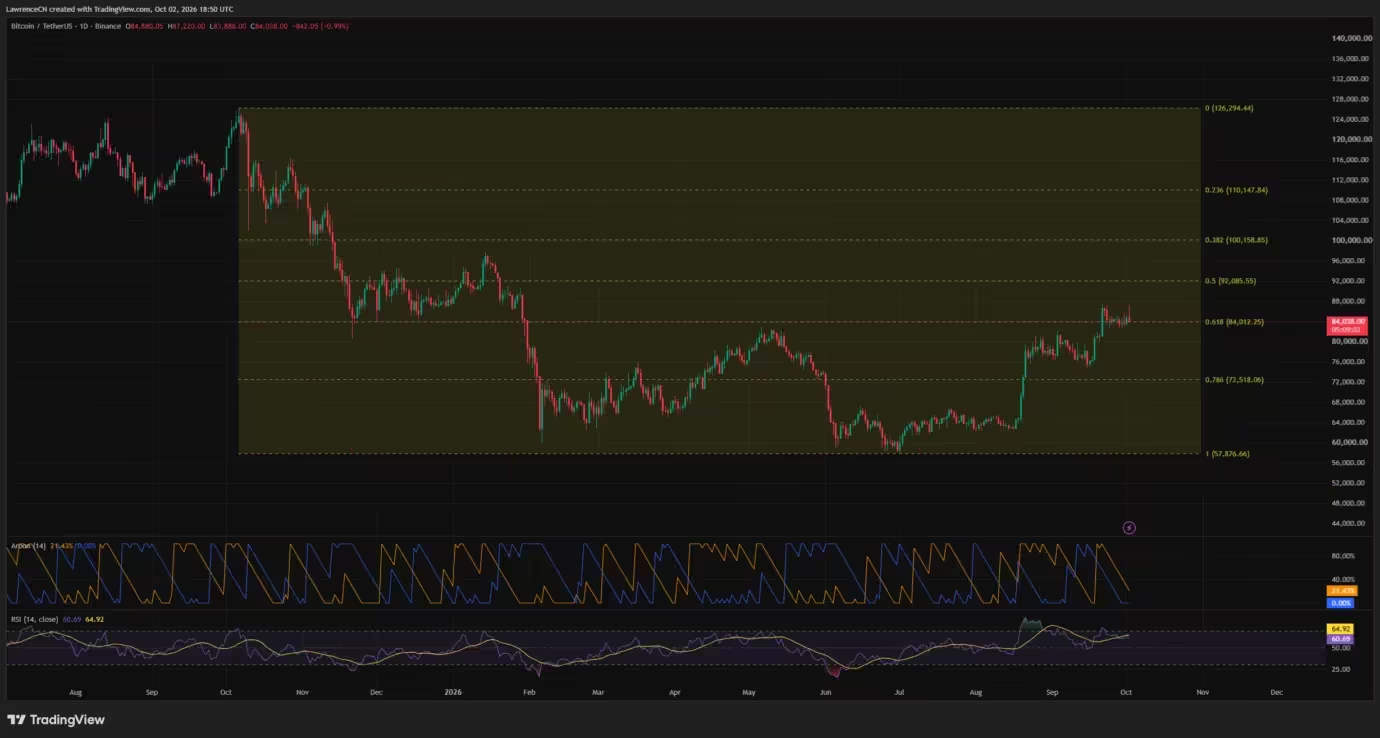
Bitcoin price daily chart — Oct. 3
On the daily timeframe, momentum indicators show a tempered advance. The relative strength index sat at 60.69, under its moving average near 64.92. An RSI north of 50 keeps the medium-term bias mildly bullish, but the shortfall versus its average signals a weakening of the recent push. Aroon readings echoed the pause, with Aroon Up slipping while Aroon Down remained low, reflecting consolidation between recent peaks and prior lows.
Below the 61.8% Fibonacci, visible support clusters appear around the $82,000 to $83,000 zone, followed by the psychologically important $80,000 level and the September base near $75,000 to $76,000. If Bitcoin can reclaim yesterday's highs and clear the $87,220 level, attention would turn toward $88,000 to $90,000, while a farther Fibonacci reference sits near $92,086.
Short-term structure: Bollinger Bands and the 4-hour view
The 4-hour TradingView chart returns an even clearer picture of intraday support and resistance. BTC pulled back to the middle of the Bollinger Bands, with the 20-period moving average around $84,227. The upper band is approximately $86,092 while the lower band aligns near $82,362, overlapping key support identified by market commentators.

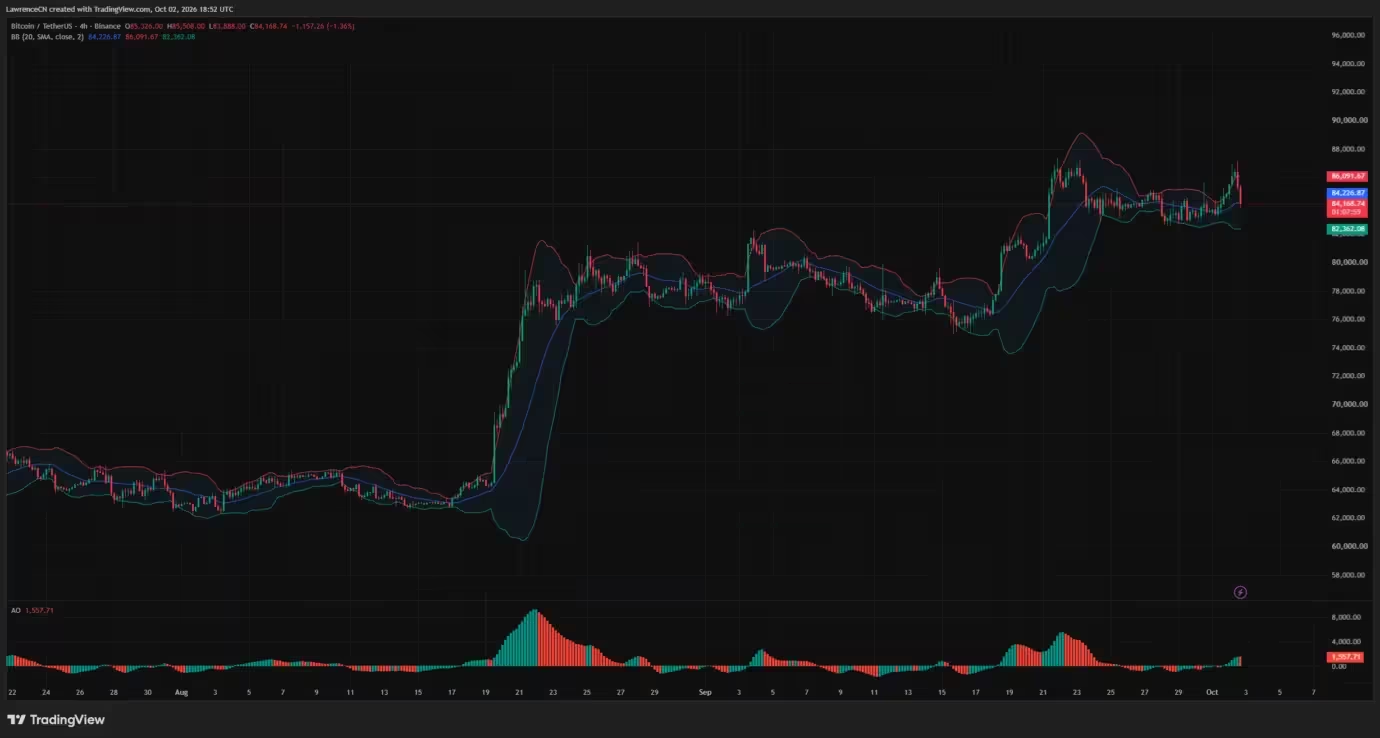
Bitcoin price 4-hour chart — Oct. 3
The Awesome Oscillator remained positive but softened, producing a red histogram bar after a run of green bars, signaling declining bullish momentum on the shorter timeframe. For traders hoping for a near-term recovery, the middle band near $84,227 is the first technical reference, then the upper band at $86,092 and the recent high of $87,220. On the downside, the lower Bollinger band close to $82,362 matches the crucial $82,000 threshold flagged by analysts as the line that could deteriorate the bullish setup if lost.
Derivatives heatmap shows dense liquidation bands
CoinGlass liquidation data shows concentrated clusters both above and below the current market price. A bright liquidation band sits around $83,500 under the market, while significant upper-liquidation concentrations appear near $85,100 and $86,000 to $86,400. The most notable upper cluster is around $87,700, slightly above recent highs, which could trigger short squeezes if buyers push through.
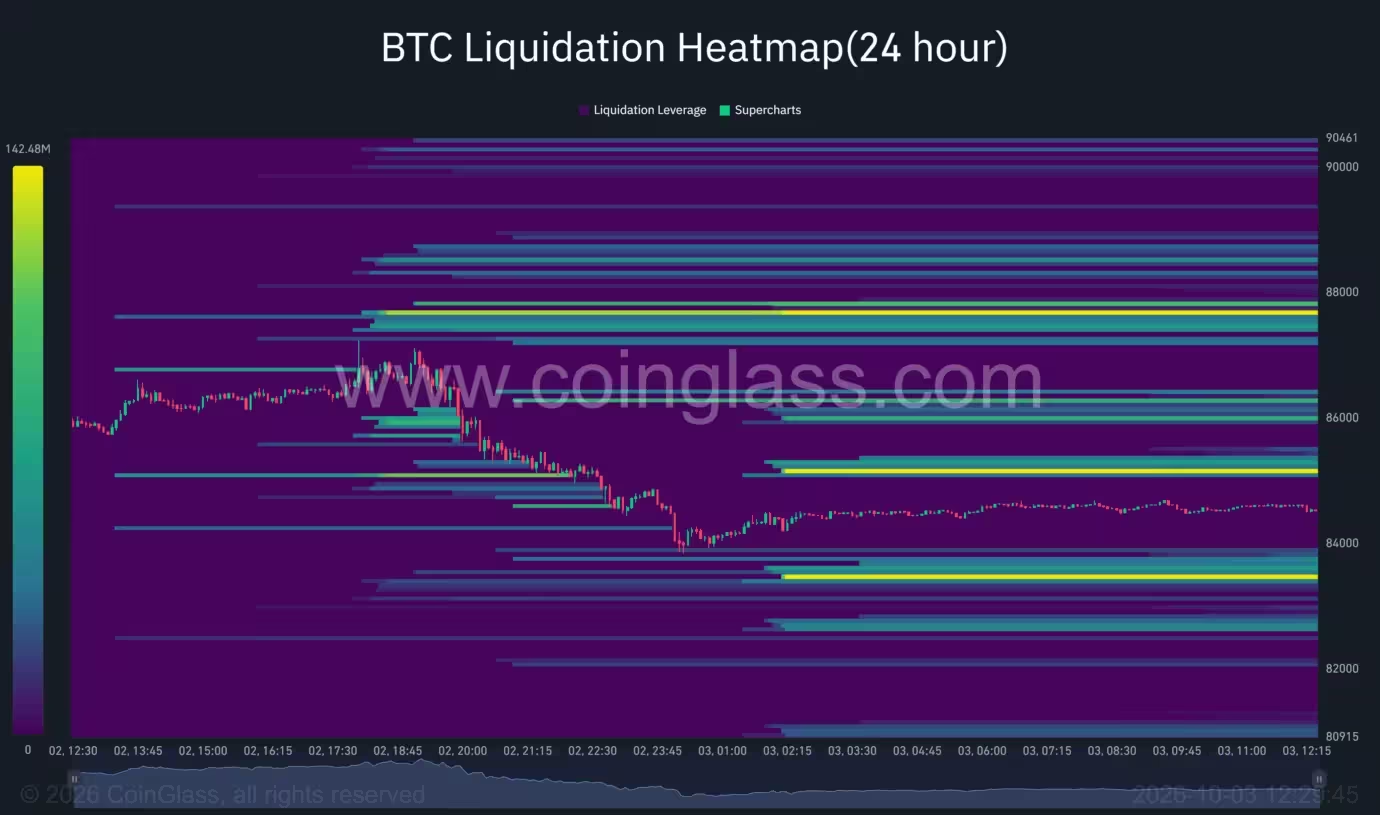
Bitcoin liquidation heatmap
Additional lower liquidation bands are visible near $82,600 to $82,800 and close to $82,000, reinforcing how derivatives positioning compresses risk around the same support levels highlighted by spot charts. Pseudonymous market observers point to thick order-book bids around $80,000 to $82,000 and substantial asks stacked from $84,000 through $90,000, creating a scenario where a move toward $90,000 depends on lower bids holding and the market absorbing sell-side pressure above BTC.
Analyst views and conditional scenarios
Prominent analysts have voiced a conditional bullish bias while warning that failure to defend the lower range would open a riskier path. Altcoin Sherpa emphasized that buying is likely near support but warned that losing $82,000 could reduce the constructive setup and invite a deeper sell-off. Another trader, Wealthmanager, described the order-book landscape and suggested that a rally toward $90,000 requires BTC to work through the visible sell orders and rely on bids clustered below.

These viewpoints align with on-chain and derivatives data: liquidation clusters form natural barriers, while order-book depth defines the market's resilience as ETFs and institutional flows attempt to exert directional influence.
US spot ETF flows moderate after September peak
Institutional demand through US spot Bitcoin ETFs showed a notable slowdown after a late-September surge. Farside Investors reported inflows peaked near $999 million on Sep. 21, followed by a sharp decline to $134.5 million on Sep. 25. Across several sessions the week of late September, investors still added roughly $2.39 billion, but the pace decelerated thereafter. The week starting Sep. 28 saw smaller inflows of $31 million and $66.2 million, then recorded net outflows on Sep. 30 totaling $148.7 million as funds such as Fidelity's FBTC, Bitwise's BITB and BlackRock's IBIT experienced withdrawals.
The shift from aggressive ETF accumulation to a more measured buying pace corresponds with Bitcoin's inability to hold gains above the September highs. Slower ETF demand can reduce the fuel available for sustained rallies, leaving spot and derivatives markets to determine near-term direction.
Key levels and trade considerations
For traders and investors monitoring Bitcoin, the immediate references to watch are:
- Daily Fibonacci support: $84,012
- 4-hour Bollinger lower band and support: ~$82,362 and the $82,000 threshold
- Short-term resistance: $86,092 (upper Bollinger band) and $87,220 (recent high)
- Higher resistance cluster and liquidation area: $87,700 to $90,000
Risk management remains essential. Market participants should monitor liquidation heatmaps, order-book depth, and ETF flows alongside classic technical indicators such as Bollinger Bands, RSI, and Fibonacci retracements. A failure to hold the $82,000 area could accelerate downside risk toward the $75,000s, while a clean reclaim of $87,220 could clear the path toward the $88,000 to $92,000 range.
Outlook
Bitcoin’s current position reflects a market in consolidation after a sharp September rally. Momentum has cooled, but the prevailing structure remains constructive so long as support around $82,000 to $84,000 holds. Short-term traders will watch Bollinger band dynamics and liquidation clusters closely, while medium-term investors will be influenced by whether spot ETF demand resumes at scale. The next decisive move is likely to depend on which side can absorb nearby liquidation zones: buyers reclaiming and holding above $86,000, or sellers forcing a clear break beneath $82,000.

Overall, BTC looks poised for a test of resilience. Traders should stay alert to changes in derivatives positioning and ETF flows, and use clear risk controls given the compressed technical landscape and the large sums queued on both sides of the order book.

Leave a Comment
Comments
No comments yet. Be the first.