

BNB price has entered October near $788 after a roughly 11% gain in September, with the 37th quarterly token burn and an 800–807 breakout shaping the near-term setup. This report reviews the technical picture, burn mechanics, network catalysts such as tokenized stocks, and three plausible price paths for October.
Current market snapshot and recent momentum
CoinGecko data show BNB trading around $788 on Oct. 4, up about 2.5% over 24 hours and roughly 1.2% across the past seven days. Market capitalization sits near $105 billion, supported by a circulating supply of approximately 130 million BNB.
September extended a recovery already in motion since August. Historical data place BNB’s September open near $691 and a month-end close around $768 — an increase on the order of 11%. August had produced an even stronger advance of close to 18%. During September, BNB briefly tested roughly $806.68 before retreating, leaving the $800 area as the primary nearby resistance heading into October.
Technical levels to watch: resistance and support
The immediate technical test for October is the $800 barrier. Price has traded through this zone intraday, but buyers have not yet secured a daily close and sustained support above it. A clean daily close above $800 followed by follow-through beyond the September high (around $807) would reinforce the recovery and set the stage for higher short-term targets near $820 and $850.
Back in May, the 800–820 region emerged as a technical objective after BNB cleared a $700 neckline; at that time the move was supported by improving momentum and a bullish MACD structure. Since then the market has rotated through several phases. On Sept. 17 BNB was trading near $721, with support concentrated around 709–710 and intra-month resistance tied to 729–740. The subsequent push toward $800 and the pullback left the chart in a transitional state.

Monthly momentum indicators
Monthly indicators present a mixed but cautiously constructive picture. The monthly relative strength index (RSI) has recovered to approximately 56.66, essentially aligned with its moving average (around 56.69). An RSI above 50 suggests moderately positive momentum, though the reading remains comfortably below the overbought threshold of 70.
MACD on the monthly chart is less supportive. The MACD line sits near 36.50, under the signal line near 51.29, and the histogram is negative at roughly -14.80. That said, the negative histogram bars are shrinking, signaling that bearish momentum may be easing even though a confirmed bullish crossover has not yet occurred.

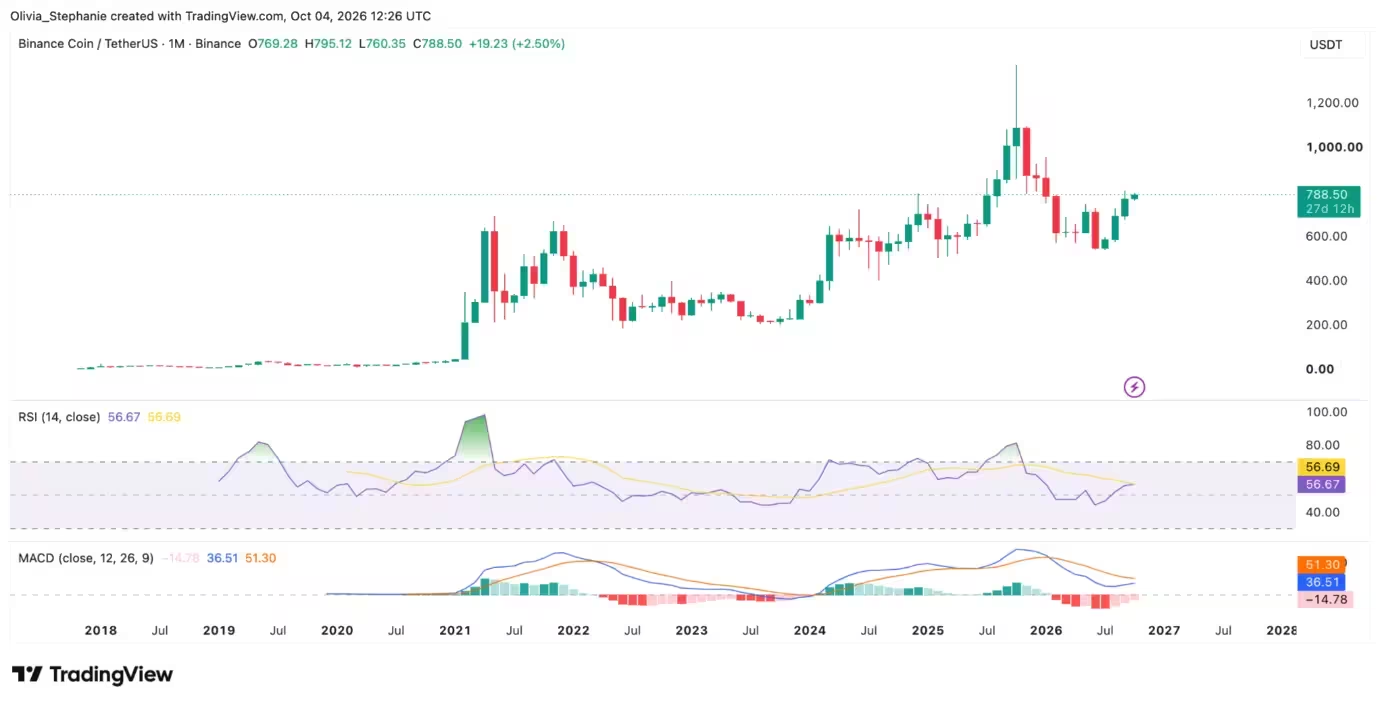
BNB price chart
Why the 37th BNB burn matters
The upcoming 37th quarterly token burn is an important fundamental event that brings supply dynamics into focus for October. As of Oct. 4, BNB Chain had not published an official date for this burn; the last three burns occurred in mid-January, mid-April and mid-July, so a mid-October timing would align with the quarterly cadence.
The most recent quarterly burn on July 15 removed 1,615,827.795 BNB from circulation, valued at about $931.7 million at the time. After that transaction the reported total supply stood at 133,166,127.91 BNB. That event reduced available supply by more than 1.6 million tokens and moved the network incrementally toward its long-term target supply.
BNB Chain’s Auto-Burn mechanism aims for a total circulating supply target of 100 million BNB. The quarterly burn formula factors in BNB’s market price and the number of blocks produced on BNB Smart Chain during the quarter, which means the precise amount removed in the 37th burn will not be known until the Foundation publishes the completed transaction.
Separately, BNB Chain implements BEP-95, which destroys a fixed portion of gas fees per block. Validators influence the burn ratio through governance. By July, roughly 291,000 BNB had been removed via BEP-95. Between the quarterly and gas-fee burns, the protocol has a consistent supply-reduction mechanism, though burns do not automatically produce immediate price jumps — demand, liquidity and market conditions remain decisive.
Network activity and tokenized stocks as complementary catalysts
Beyond token burns, network usage and new product-led demand are additional bullish inputs for BNB. In June, BNB Chain reported that tokenized stocks and ETFs on the network exceeded $1 billion in market capitalization, supported by more than 709 tokenized equity products. At that time cumulative tokenized-stock trading volume had already passed $5 billion. September data still placed the network’s tokenized-stock market around the $1 billion mark while the broader tokenized-stock market was near $3.5 billion.
BNB Chain’s tokenization suite includes bStocks — BEP-20 tokens that represent U.S. securities backed 1:1 by the underlying shares — and the chain has indicated that supported assets can transition to self-custody and certain DeFi uses. Binance itself has launched tokenized versions of companies such as Nvidia, Tesla and Circle, offering eligible users around-the-clock trading of these synthetic equities.

BNB Chain is also running a Tokenized Stocks Edition hackathon in October. Submissions close on Oct. 11, screening runs Oct. 12–14, judging continues through Oct. 23, and winners are scheduled to be announced the week of Oct. 26. The hackathon carries a $20,000 prize pool and targets tools for tokenized equities including trading agents, portfolio managers and DeFi integrations — all of which could incrementally increase on-chain activity and demand for BNB.
Infrastructure upgrades have accompanied product growth. The August Pasteur hard fork introduced a block-building system that by mid-September was processing around 98% of blocks and carrying approximately 28% more gas per block than the former Bid V1 route. Pasteur also strengthened bridge verification and validator controls while improving block-processing capacity, which supports higher throughput for tokenized assets and DeFi applications.
Three plausible BNB price paths for October
Given the mix of technicals and fundamentals — upcoming burn mechanics, rising tokenization activity, and recent protocol upgrades — BNB’s October trajectory can be framed into three primary scenarios: bullish breakout, sideways consolidation, and bearish pullback.
Bullish breakout: $800–$850
Conditions: BNB secures a daily close above the $800–$807 range and establishes that zone as support, confirming a break above the September high.
Implication: A confirmed breakout through $807 would clear the nearest structural resistance and likely re-focus attention on $820 and then $850 as the next technical targets. From a starting point near $788, a rise toward $850 would require an increase in the low-to-mid single digits percentage-wise — notably below the distance to BNB’s all-time high. This path could be catalyzed by a combination of a meaningful quarterly burn, increasing tokenized-stock adoption, and positive macro sentiment in crypto markets.
Sideways trading: $740–$800
Conditions: Buyers successfully defend the mid-$700s but fail to sustain momentum above $800 despite the quarterly burn.
Implication: BNB could spend time rotating between roughly $740 and $800 while market participants weigh the supply reduction from the burn against demand signals. This would represent consolidation rather than rejection, and could precede a stronger move if on-chain activity and macro conditions improve.

Bearish pullback: $700–$740 (and lower tests)
Conditions: BNB loses the mid-$700 support region and selling pressure accelerates toward earlier September consolidation ranges.
Implication: A break under $740 would open the door to renewed tests of $720 and $700, areas that served as consolidation and support during September. On the monthly chart, larger support sits around $700 and then in the $600s if the recovery fails more deeply. Such a move would likely require deteriorating market liquidity or negative macro catalysts rather than being driven solely by the burn event.
How to frame the burn versus market forces
It’s important to recognize that the quarterly burn is a mechanical supply reduction and not a price guarantee. While burns reduce outstanding token supply — and in some narratives should be bullish if demand stays steady or rises — the market’s reaction depends on demand, liquidity, liquidity provider behavior, and broader crypto market conditions. The Auto-Burn formula’s dependence on price and block production also means that the burn amount is dynamic rather than fixed.
Nonetheless, burns can act as a positive catalyst when combined with improving network fundamentals. In BNB’s case, the growth of tokenized stocks, the hackathon program, and protocol upgrades such as Pasteur all support a narrative of rising utility and on-chain demand that could magnify the burn’s effect on price over time.
Bottom line: October is about clearing $800
For traders and investors, the clearest near-term line in the sand is the $800–$807 zone. A decisive conversion of that range from resistance into support would favor the bullish path and make higher targets like $820 and $850 more probable. Absent a confirmed breakout, sideways trading between the mid-$700s and $800 would be the most likely middle-ground outcome. A failure to defend mid-$700 support would shift focus to $700 and potentially lower levels.
BNB remains well below its all-time high of $1,369.99, with the current price roughly 42% under that peak; an October breakout above $800 would represent a continuation of the recent recovery rather than a return to record territory. Watch the timing and size of the 37th burn, on-chain flows tied to tokenized stocks and ETF activity, and macro crypto market liquidity to gauge which of the three scenarios becomes dominant.
Key data points referenced: July 15 quarterly burn of 1,615,827.795 BNB (post-burn total supply ~133,166,127.91 BNB); BEP-95 burns of ~291,000 BNB by July; tokenized-stocks market on BNB Chain > $1 billion (June); hackathon timeline with submissions closing Oct. 11 and winners announced the week of Oct. 26; Pasteur hard fork increased block-processing capacity by ~28% and processed ~98% of blocks by mid-September. Monthly RSI ~56.66 and MACD line near 36.50 vs signal ~51.29 (histogram ~-14.80) as of early October.
Disclosure: This analysis is for informational purposes only and does not constitute financial advice. Cryptocurrency markets are volatile and carry significant risk. Conduct your own research and consider your risk tolerance before making trading decisions.

Leave a Comment
Comments (1)
Wait, the burn is dynamic based on price? so how much will actually be removed this quarter, anyone got a guess or calc? sounds fuzzy..