

Ethereum (ETH) opened October trading near $2,695 after a strong summer recovery — roughly +32.6% in August and another +8.8% in September. The immediate technical obstacle sits in the $2,775–$2,800 area. A decisive break and close above that range would likely clear the path toward $3,000, while failure to hold the mid-$2,600s could expose ETH to a deeper pullback toward $2,400–$2,500.
Market snapshot
On Oct. 4, CoinGecko showed ETH changing hands around $2,693–$2,695, up about 0.7% over 24 hours and nearly flat over seven days. The 24-hour low-high band was roughly $2,678–$2,697, and market capitalization hovered near $328 billion. Price activity in early October has seen ETH test an intraday high close to $2,775 on Oct. 2 but fail to sustain that move and settle back around $2,700.
Technical picture: momentum and barriers
ETH’s recovery through August and September pushed price above prior consolidation between $2,400 and $2,550, but the token has struggled to secure support above the $2,775–$2,800 rejection zone. The immediate bullish thesis depends on ETH closing convincingly past that level and holding it as support. If that happens, targets in the near-term include $2,900 and $3,000, with the rising channel pointing to roughly $2,950–$3,100 later in the month if momentum persists.
Indicators
On the monthly TradingView chart, the Relative Strength Index (RSI) sits at 51.53 with a moving average near 48.46 — a reading above 50 signals improving momentum but is not near overbought territory (typically above 70). Meanwhile, MACD is still negative: the monthly MACD line is close to -98.3 versus a signal line around -66.4, leaving a histogram near -31.9. Although MACD lines have narrowed, a bullish crossover has yet to materialize.
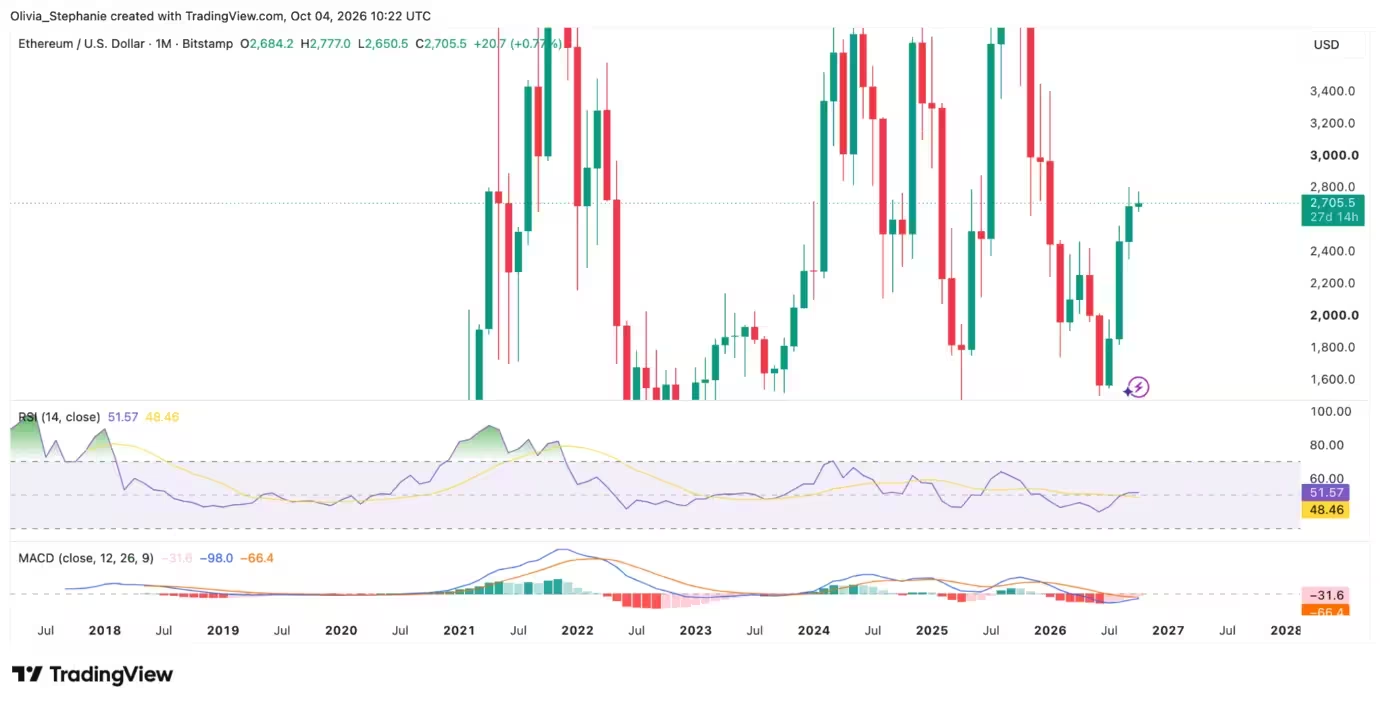
Ethereum (ETH) price chart
Support and resistance levels traders are watching
- Immediate resistance: $2,775–$2,800
- Near-term targets on breakout: $2,900 and $3,000
- Key downside support: $2,400–$2,500 (critical area from earlier 2026 consolidation)
- Warning zone below support: $2,350–$2,360 (would threaten the bullish continuation pattern)
Institutional flows: ETFs and exchange activity
Institutional appetite bolstered Ethereum during parts of September, but flows have become more mixed heading into October. Arkham Intelligence reported that BlackRock’s Ethereum ETF products bought about $1.57 billion of ETH across roughly 20 days in mid-September — with ETHA accounting for approximately $1.27 billion and ETHB for $296.5 million. Those purchases reflected investor allocation into ETF shares, not direct corporate balance-sheet accumulation by BlackRock.

However, ETF momentum cooled at month-end. Farside Investors recorded combined U.S. spot Ether ETF outflows of around $59.6 million on Sept. 30, $55.4 million on Oct. 1 and $17.3 million on Oct. 2. Including previous sessions, the Sept. 28–Oct. 2 week showed roughly $118 million in net outflows, which contrasted sharply with the roughly $689.8 million of inflows the prior week. That shift makes the ETF demand picture for October more nuanced despite earlier large purchases.
On-chain and exchange flows
Exchange-flow readings from CryptoQuant analyst R3N echoed the mixed tone. Throughout most of September, inflows and outflows tracked closely, but a recent snapshot showed about 129,700 ETH leaving exchanges versus 116,700 ETH entering — the first clear divergence in weeks. R3N cautioned that a single reading does not confirm a persistent accumulation trend.
Network upgrades and catalysts: Glamsterdam on Sepolia
One near-term technical catalyst for Ethereum is the Glamsterdam upgrade. The Ethereum Foundation has scheduled Glamsterdam to activate on the Sepolia testnet at 13:53:36 UTC on Oct. 6. Node operators on Sepolia will need to update both execution and consensus clients before the fork. Mainnet timing has not been finalized; Sepolia activation should be treated as a public test event rather than a mainnet launch.

Glamsterdam bundles Amsterdam execution-layer changes with Gloas consensus-layer updates. Key features include enshrined proposer-builder separation (PBS), block-level access lists and gas-pricing adjustments designed to improve execution efficiency and handle state growth more sustainably. The official roadmap currently lists Glamsterdam for mainnet in Q4 2026, but that date remains provisional and will depend on Sepolia and subsequent testing results.
Regulatory and product developments
On Oct. 2, the SEC approved a Cboe BZX rule change permitting the listing of a 3x Ether ETF — a leveraged product that seeks three times the daily performance of an Ether futures benchmark. The exchange rule approval enables listing but does not equate to a bullish forecast for ETH or imply additional spot demand; leveraged ETFs are trading instruments with elevated risk and are designed for short-term tactical exposure rather than long-term holding.
Scenario-based price outlook for October
Technically, October’s outcome centers on whether ETH can clear $2,800 and hold the rising channel’s lower boundary. We outline three realistic scenarios for the month:

1) Channel holds (Bullish base)
Price band: $2,650–$3,050. If ETH defends its rising channel and closes above $2,775–$2,800, that would reopen $2,900 and $3,000 as plausible short-term targets without requiring a full structural regime change.
2) Consolidation (Neutral)
Price band: $2,500–$2,800. The market could consolidate as buyers protect the recovery but repeatedly fail to sustain a push past $2,800. That outcome would keep volatility elevated but retain the possibility of a renewed breakout later in the month.
3) Channel breaks (Bearish)
Price band: $2,400–$2,500. A loss of channel support and a sustained move below the mid-$2,600s would increase the likelihood of a retest of the prior breakout zone near $2,400–$2,500. A deeper invalidation would require a break under $2,350–$2,360, which would seriously weaken the bullish continuation thesis.
Crypto.news’ price model currently places a base October scenario near $3,034, a bearish estimate around $2,579 and a bullish stretch near $3,641. Model outputs are probabilistic, not guaranteed, and will evolve with new market data.
Analyst perspectives and macro context
Short-term analysts stress the importance of the $2,800 weekly close. Crypto commentator Ted Pillows flagged that reclaiming $2,800 on the weekly close would strengthen bullish momentum and make $3,000 a more credible short-term target.
Longer-term chartists see a different horizon. Analyst Ali Martinez noted that ETH has been trading inside a rising monthly channel spanning several years; the channel’s upper boundary sits near $5,000 and a decisive breakout above that could project further gains toward $8,800. That scenario is conditional and speaks to multi-year structural upside rather than October-specific dynamics.
Institutions have also revised multi-quarter views. Citi raised its 12-month Ether target to $3,028 (from $2,240) on Oct. 1, citing stronger crypto activity, favorable macro dynamics and renewed ETF interest. That target is a 12-month projection, not an immediate monthly call.

What traders and investors should watch
- Daily and weekly closes around $2,775–$2,800 — conviction here matters for directional bias.
- ETF flows and institutional demand trends — continued inflows would support higher prices; sustained outflows could weigh on momentum.
- Exchange net flows and on-chain accumulation signals — sustained withdrawals from exchanges can indicate longer-term accumulation if confirmed across multiple readings.
- Glamsterdam testnet results and any mainnet timeline updates — successful tests reduce protocol risk and can be bullish for sentiment.
- Macro drivers and risk appetite — macro headlines, interest-rate expectations and equity market behavior will continue to influence crypto flows.
Bottom line
October’s near-term trajectory for ETH hinges on a relatively narrow band: clearing and holding $2,775–$2,800 would significantly raise the odds of a run toward $3,000, while failure to defend the mid-$2,600s opens the door to testing lower support around $2,400–$2,500. Mixed ETF flows and cautious on-chain readings make the start of the month more ambiguous than the mid-September buying wave alone suggested. Traders should monitor weekly closes, ETF activity and Sepolia’s Glamsterdam test to assess whether momentum can sustainably push Ethereum back to the $3,000 level this month.

Leave a Comment
Comments
No comments yet. Be the first.