

Cardano reclaims momentum as ADA trades near $0.269
Cardano (ADA) traded around $0.269 on Oct. 5 after a rally that pushed prices above $0.26 and reached an intraday high of $0.2768. The breakout prompted market participants to flag $0.275–$0.28 as immediate resistance, while a potential pullback zone near $0.264 has emerged as a short-term support level. This article breaks down the technical setup, key indicators, liquidation clusters and institutional developments shaping ADA's outlook.
Key takeaways
- ADA peaked at $0.2768 before retracting toward $0.269, staying above the recent trading band.
- Daily money-flow indicators remain constructive, and price sits above core moving averages.
- Liquidation heatmaps show concentrated stop orders below $0.27 at roughly $0.266 and $0.257.
- Short-term resistance targets center near $0.275–$0.28, while bullish confirmation on a higher timeframe is eyed near $0.2887.
Technical picture: moving averages and money flow
ADA’s rally continues a recovery that began from roughly $0.14 in late June. On the daily chart, the token has climbed above its primary moving averages, returning to price territory last seen in May. TradingView’s daily readings place ADA trading above its 20-day simple moving average (~$0.2417), 50-day (~$0.2211), 100-day (~$0.1971) and 200-day (~$0.2132).
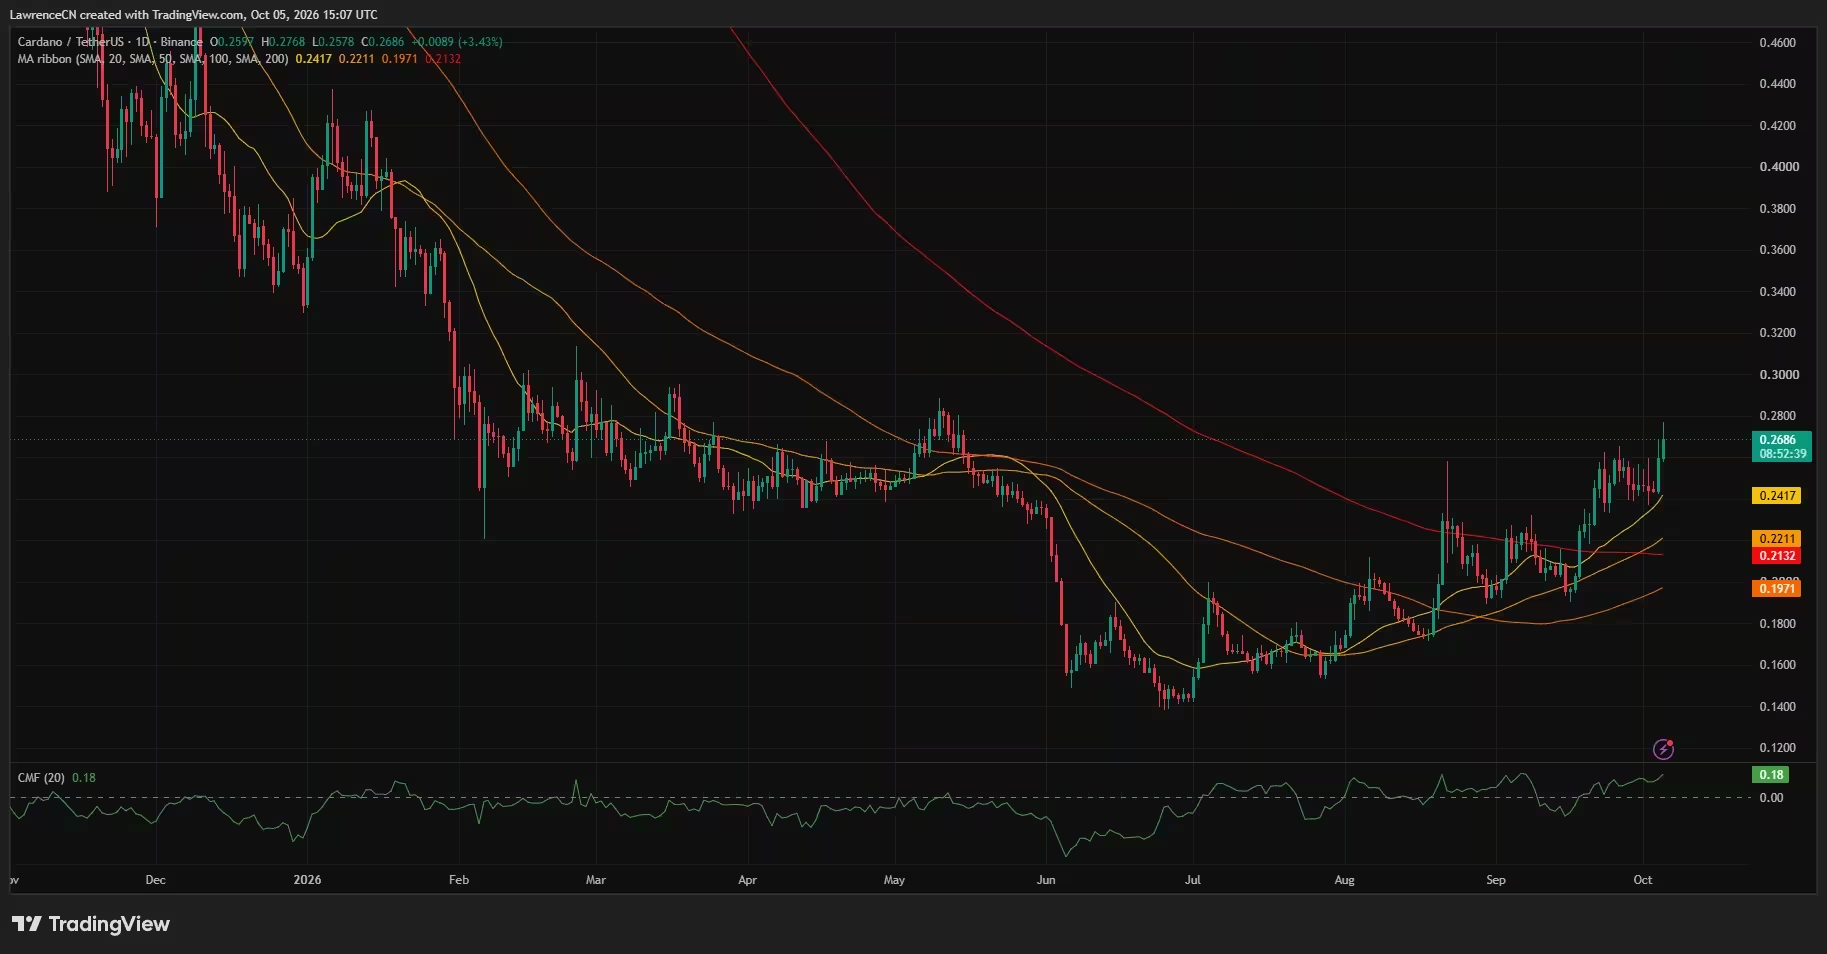
Cardano price daily chart — Oct. 5
The 20-day SMA currently leads the shorter-term averages and sits well above the 200-day line, signaling recent bullish momentum. At the latest quotes, ADA was roughly 11% above the 20-day average and about 26% higher than the 200-day SMA, reinforcing the near-term uptrend while leaving room for consolidation around the moving-average clusters.
Volume-based buying strength also supports the move. Chaikin Money Flow registered a positive reading (above zero), indicating net accumulation and adding conviction to the breakout above the prior trading band near $0.24–$0.26.
Immediate technical levels: support and resistance
On the daily horizon, the first resistance area sits between $0.275 and $0.28, where ADA ran into supply during several recent attempts. A sustained break and close above that zone would open the path toward the next supply area in the $0.28–$0.29 range — levels visited during earlier rallies in February, March and May.
Conversely, a pullback would likely find short-term support at the 20-day average near $0.2417, with a broader support band spanning the 50- to 200-day averages around $0.213–$0.221. A deeper retracement could test the 100-day SMA near $0.197.
Analyst views and target scenarios
Among active market voices, some analysts emphasized the importance of $0.27 as a dividing line for the near-term bias. One technical commentator noted a strong breakout off a $0.242–$0.247 consolidation, with an hourly candle that vastly exceeded the range's typical volume — a signal often associated with follow-through momentum.
That analyst marked $0.275 as immediate resistance after multiple rejections and indicated $0.27 as the level that must hold for bulls to keep control. A breach below $0.27 would likely expose $0.264 as the preferred retest target, while holding above it could clear the way toward $0.28.
On a higher timeframe, another analyst focused on the two-week chart and put a bullish confirmation threshold at $0.2887. According to that view, a sustained close above $0.2887 would validate a larger macro breakout and could set multi-stage targets at $0.50, $1, $2 and beyond — though those levels are conditional and require confirmation on the higher timeframe.

These two approaches illustrate how different timeframes produce distinct trigger prices: the nearer-term setup tilts toward $0.27–$0.28 while the broader macro thesis demands consolidation above $0.2887 before aggressive upside targets are considered.
Liquidation map and intraday risk points
CoinGlass’s 24-hour liquidation heatmap highlighted where leveraged long or short positions concentrate, which can amplify intraday moves if those levels are swept. The heatmap showed price rising from roughly $0.247 to above $0.275 before easing to the current range.
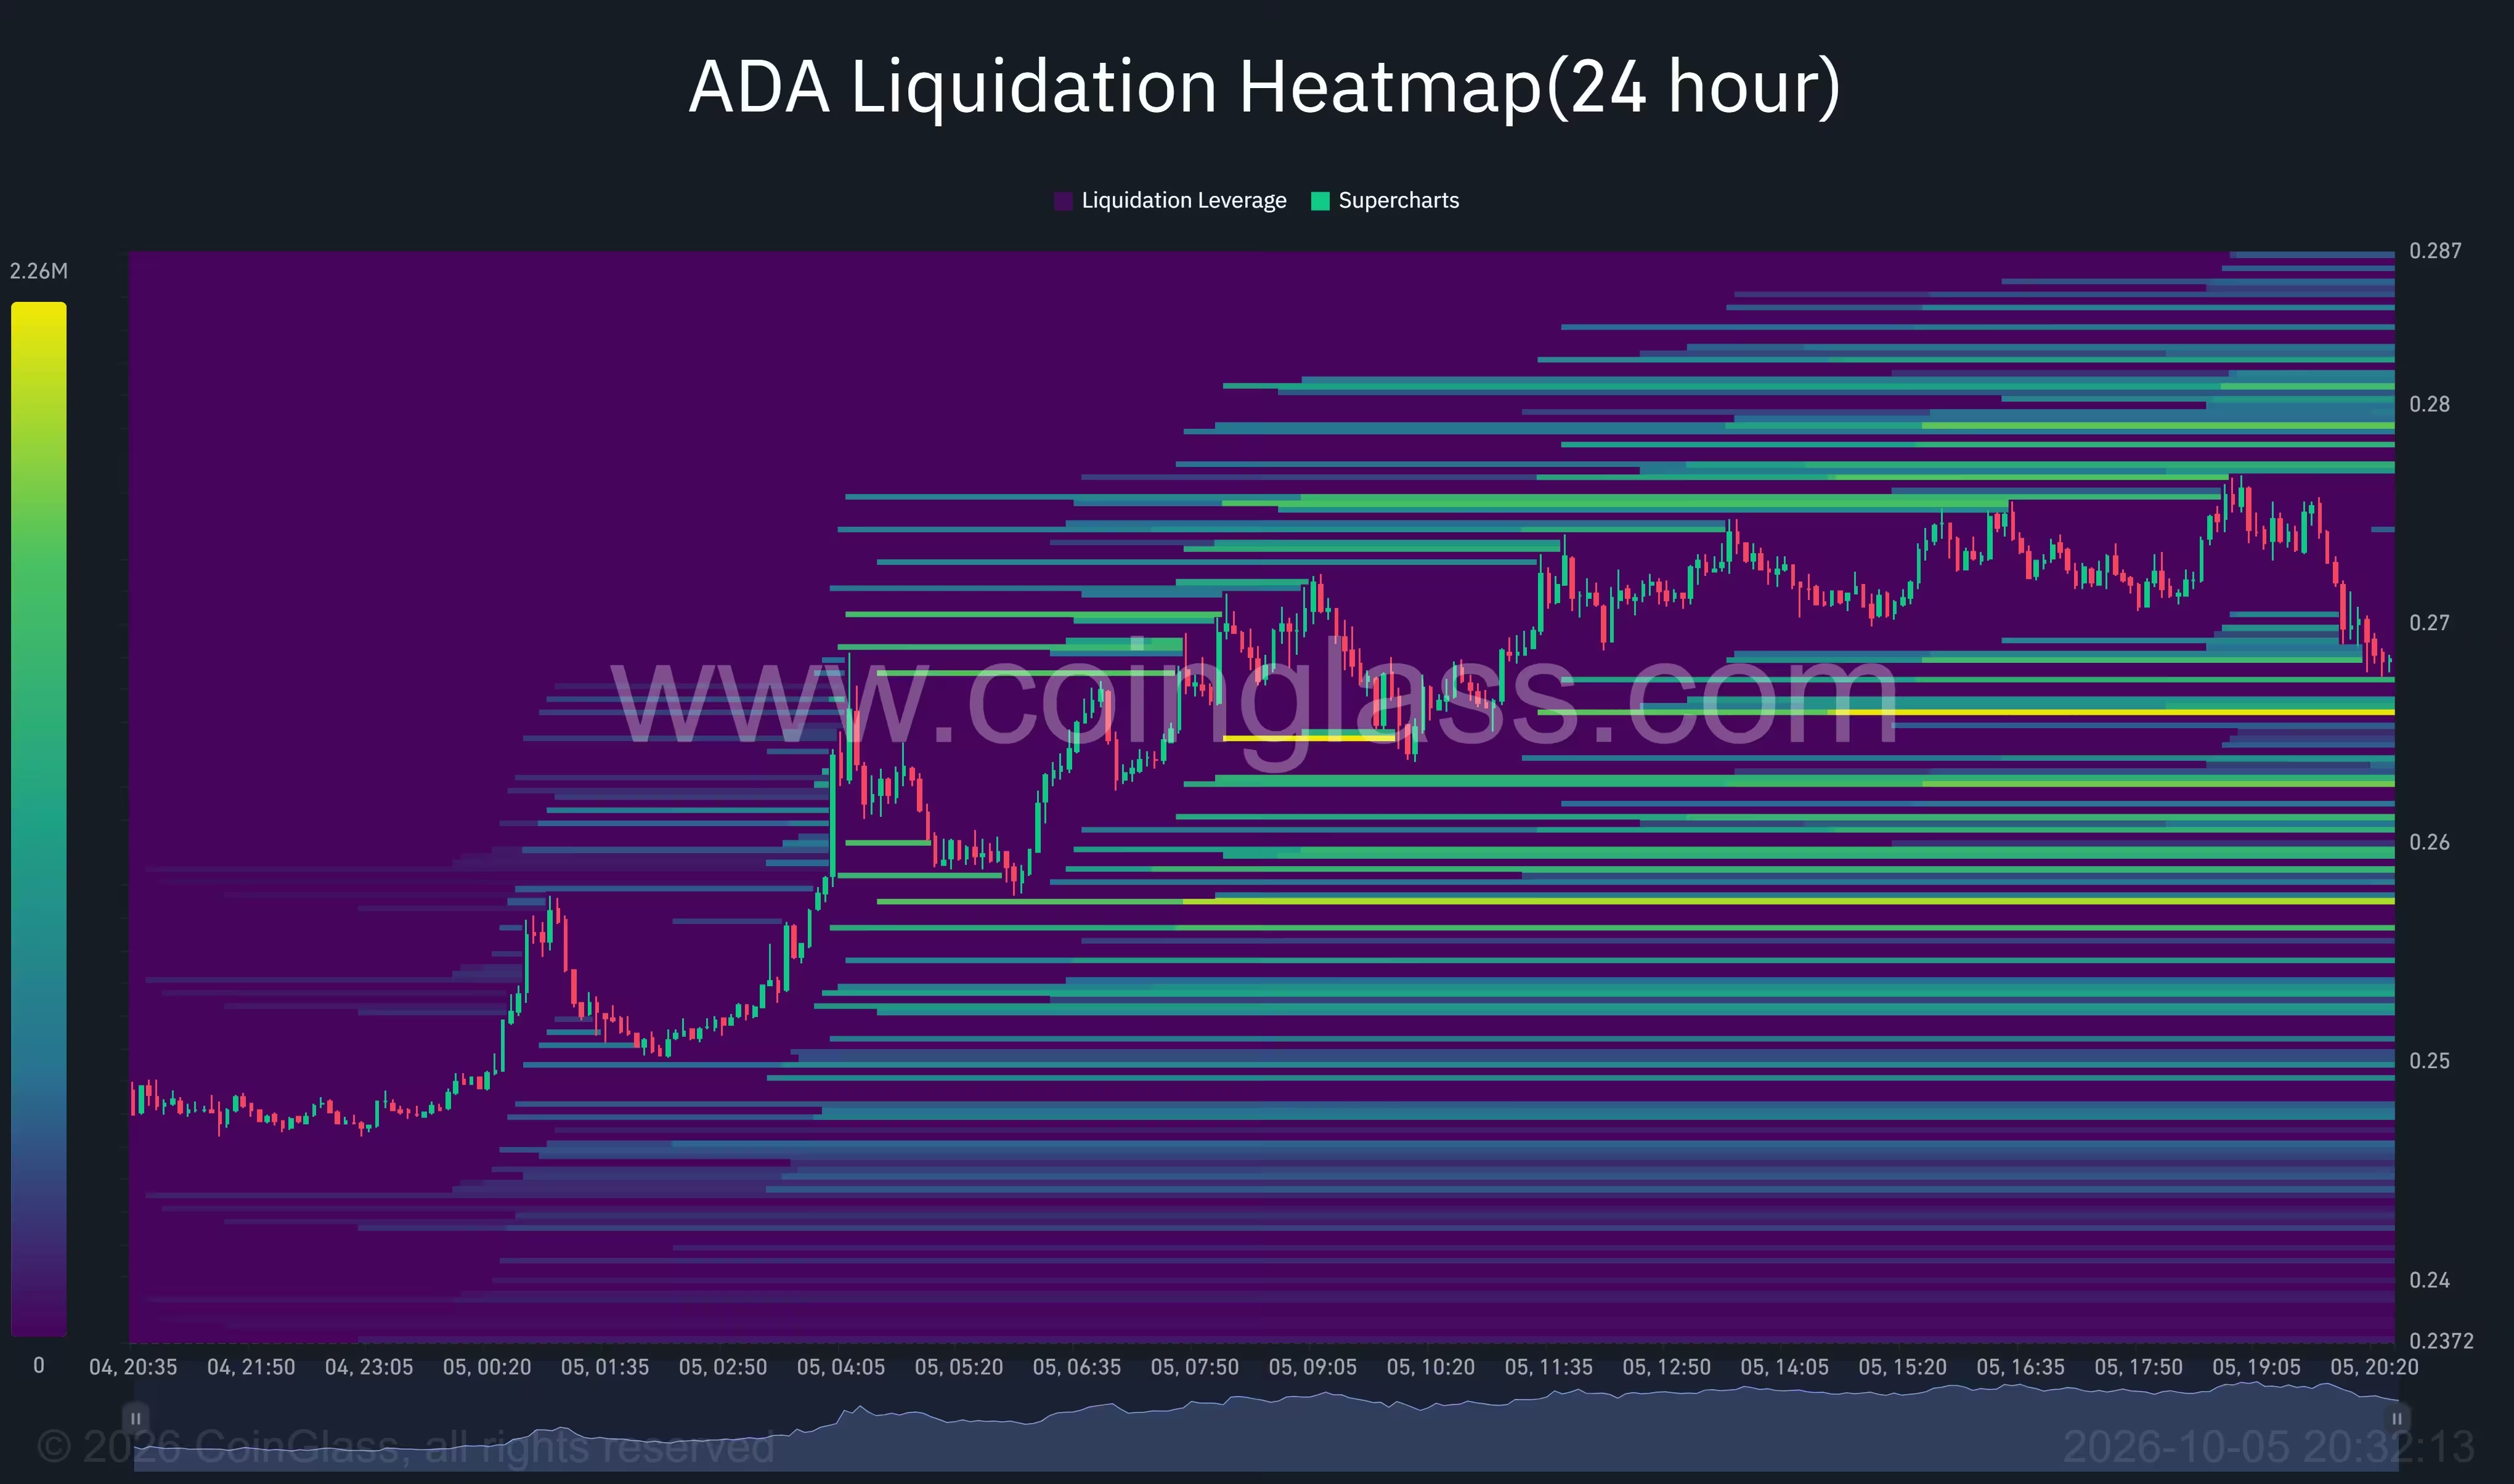
Cardano liquidation heatmap
A prominent liquidation band appears near $0.266, immediately below spot, with another strong cluster around $0.257 and additional density between $0.259–$0.263. These zones represent areas where forced liquidations could accelerate price moves to the downside if sellers overpower buyers. On the upside, heatmap concentration around $0.275–$0.277 and $0.279–$0.281 lines up with the resistance cluster at $0.28.
Short-term indicators: Supertrend and ADX
On the 4-hour timeframe, the Supertrend indicator remains bullish and sits below market price, offering a dynamic support reference near $0.2498. The Average Directional Index (ADX) was climbing from lower readings toward the 25 level, indicating strengthening trend momentum if it continues to rise.
Cardano price 4-hour chart — Oct. 5
A modest intraday pullback of about 1–2% left price still above the Supertrend line, showing that short-term indicators are aligned with a constructive bias even during profit-taking.
Institutional context: ETF eligibility and fund inclusion
Cardano’s broader narrative is being shaped by gradual institutional acceptance. As of Oct. 5, a Nasdaq-listed crypto product included ADA at a 0.6% portfolio weight, providing market-cap-weighted exposure alongside Bitcoin, Ethereum, Solana, Stellar and XRP. This inclusion took effect on Oct. 1, 2025 and is subject to quarterly rebalancing, offering a steady, if modest, institutional demand baseline.
In addition, filings for an active crypto ETF listed ADA among eligible assets in mid-2026, signaling that U.S. fund vehicles are increasingly treating Cardano as part of investable crypto universes. Institutional entries and ETF eligibility can smooth liquidity and increase demand during macro uptrends.
What traders should watch next
- Short-term bias: Monitor $0.27. Holding above it favors a push toward $0.275–$0.28.
- Confirmation level: A sustained close above $0.2887 would strengthen the macro bullish case.
- Risk zones: Liquidation bands below $0.27, especially near $0.266 and $0.257, could accelerate downside in a failing breakout.
- Indicators: Watch Chaikin Money Flow for continued accumulation and ADX for trend confirmation above 25.

Conclusion: Cardano’s latest advance shows renewed buyer interest and positive money-flow metrics, but upside beyond $0.28 depends on clearing resistance and holding key intraday support. Traders and investors should balance short-term targets with higher-timeframe confirmation levels, while keeping liquidation clusters and institutional flows in view for risk management and position sizing.

Leave a Comment
Comments
No comments yet. Be the first.