

PEPE price prediction for October
PEPE has held around $0.00000439 after a September rebound, navigating a tight range as it approaches key resistance from $0.00000450 to $0.00000469. A recent amended ETF filing from Canary Capital has added a potential U.S. catalyst, while on-chain and technical indicators highlight both upside friction and downside liquidation risk.
Key takeaways
- Daily support sits near $0.00000417 while the next significant Fibonacci resistance is at $0.00000469.
- Canary Capital submitted an amended S-1 for a proposed PEPE ETF on Oct. 2, marking a regulatory development.
- The weekly chart shows a falling-wedge breakout, but Chaikin Money Flow remains slightly negative.
- CoinGlass liquidation data points to a concentrated cluster around $0.00000464, above current market levels.
Where PEPE trades now
TradingView's Binance PEPE/USDT daily chart recorded PEPE at $0.00000438 on Oct. 5, a session decline of 0.68% from the open. The intraday high reached $0.00000458 and the low $0.00000434. Price remains comfortably above September lows but has pulled back from a late-September peak near $0.00000536, creating an October setup that blends recovery from lower levels with lingering resistance from the prior surge.
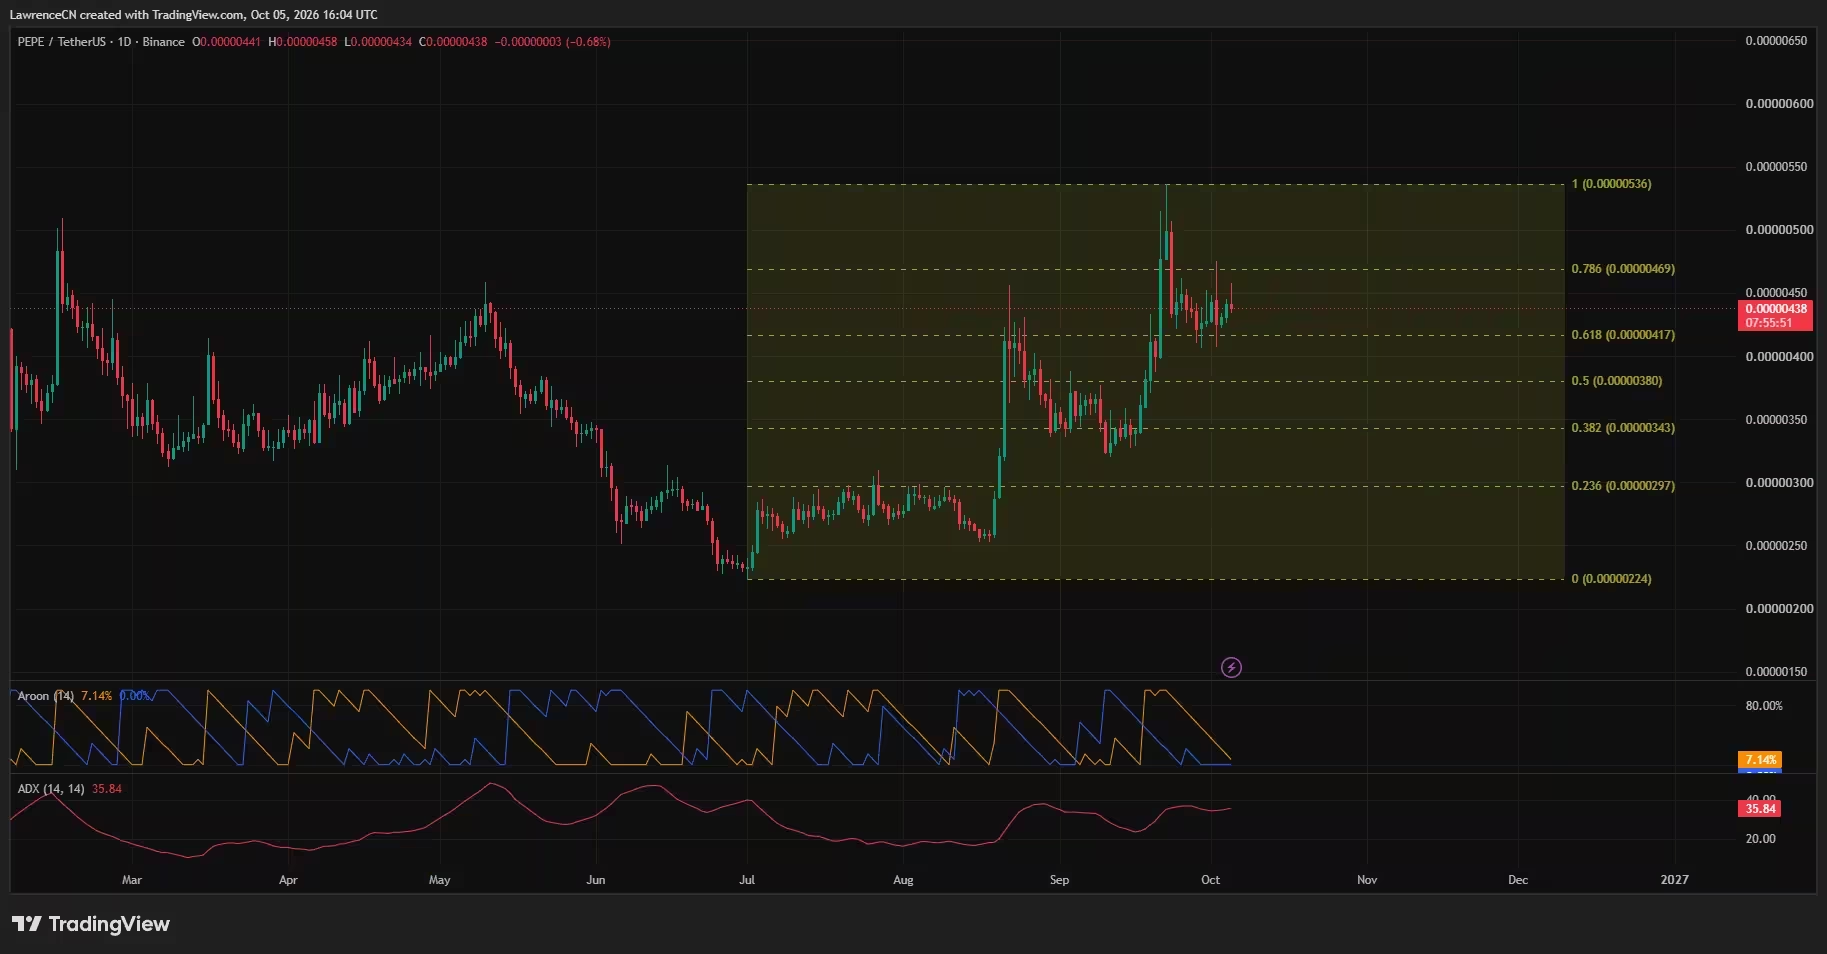
PEPE price daily chart — Oct. 5
Technical structure: Fibonacci and short-term resistance
On the daily timeframe, Fibonacci retracements place PEPE between the 61.8% level at $0.00000417 and the 78.6% level at $0.00000469. Holding the lower boundary would sustain the current consolidation above $0.0000040, while a decisive break above $0.00000469 would strengthen the technical case for another upward leg.
A move above the Oct. 5 session high at $0.00000458 would be an initial trigger toward the larger resistance band. From roughly $0.00000439, a push to $0.00000469 equals about a 6.8% rise. Clearing that zone opens a psychological round-number test at $0.0000050 (about 13.9% higher) and eventually the September peak near $0.00000536 (approximately 22.1% higher).
Technical commentators on X have echoed the same levels. One analyst placed nearby support around $0.00000408 and resistance near $0.00000450, with $0.00000504 as the next meaningful target if PEPE reclaims resistance — a view that emphasizes reclaiming horizontal supply rather than an immediate sprint back to the September top.
Momentum metrics add nuance. The daily ADX reads 35.84, signaling measurable trend strength but not direction; the two Aroon readings were near the bottom of their ranges (7.14% and 0%), which — together with sideways candles — suggest the September advance has transitioned into a consolidation phase rather than producing a fresh trending breakout.
Weekly picture: wedge breakout with cautious money flow
PEPE's weekly chart shows trading above two converging descending trendlines after clearing the upper boundary of a falling wedge — a classic breakout pattern following an extended decline from higher late-2024 prices. The weekly Supertrend has flipped green with a displayed level at $0.00000232, which serves more as a longer-term reference than immediate October support given the gap to price.
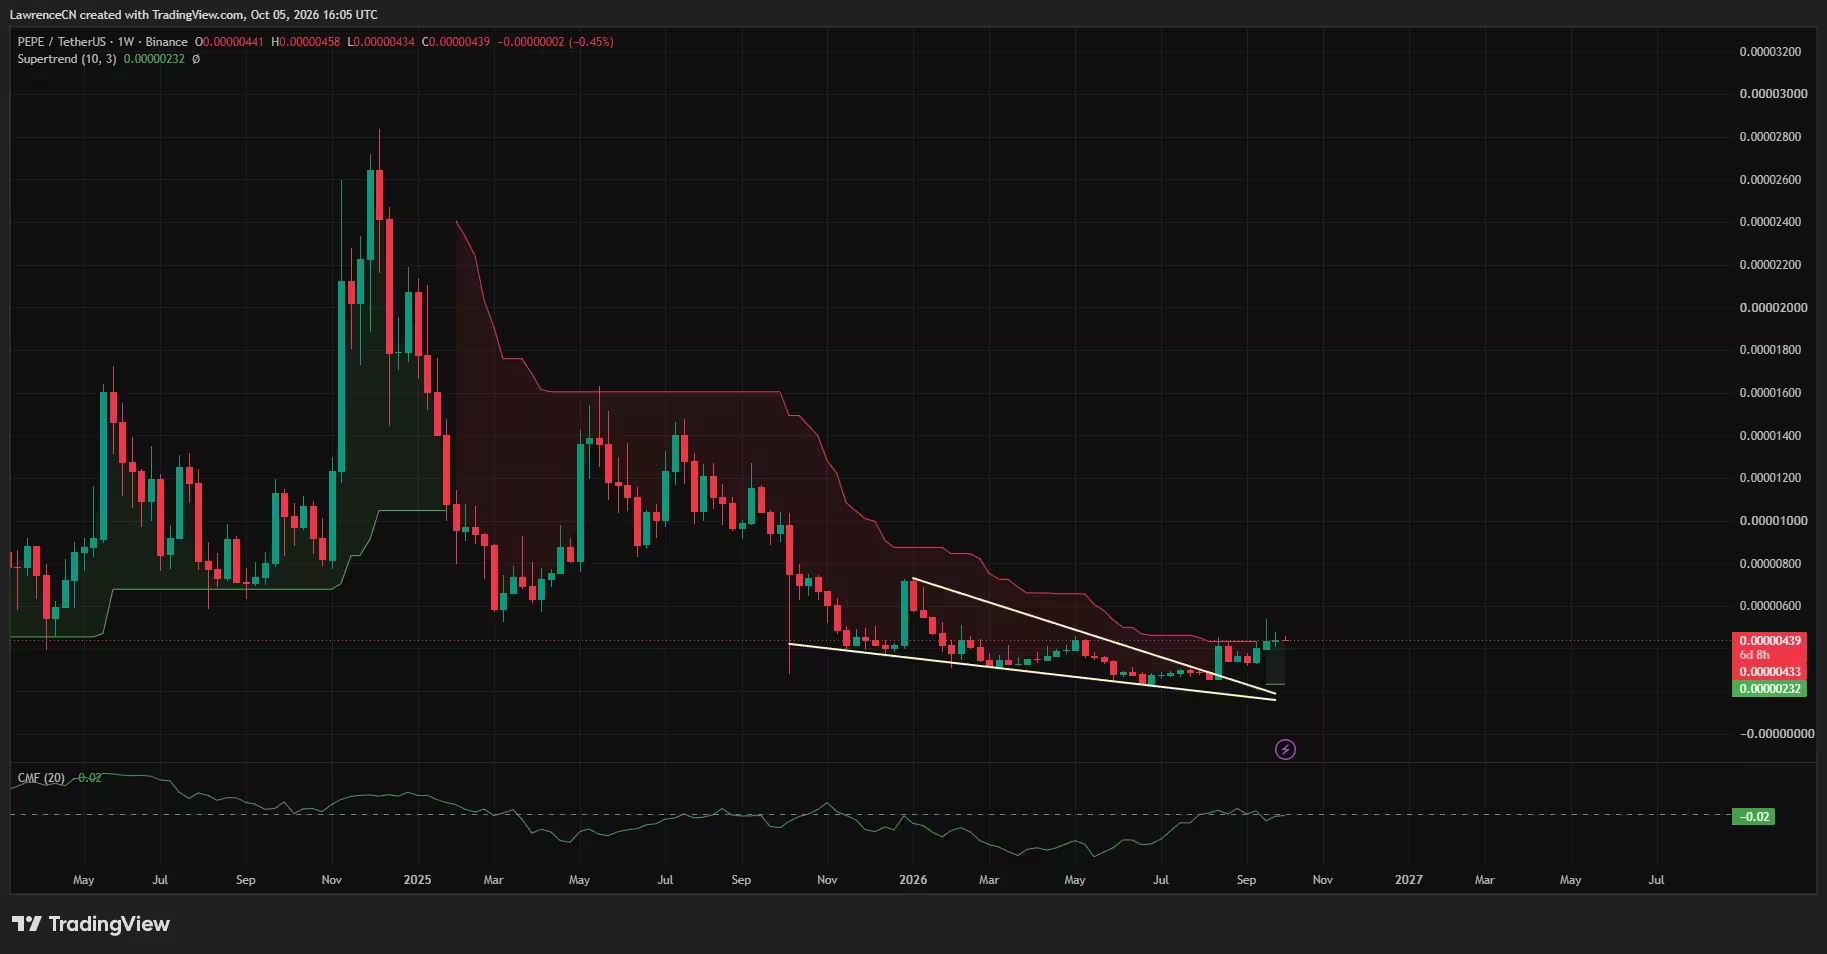
PEPE price weekly chart — Oct. 5
.avif "SEC Postpones Decision on Truth Social Bitcoin ETF Until September: What Crypto Investors Should Know")
However, weekly Chaikin Money Flow remains slightly negative at -0.02. That near-zero reading indicates the breakout lacks a clearly positive money-flow confirmation at this stage, so follow-through buying is not guaranteed despite the bullish pattern. Some traders compare the current higher-timeframe retest to setups that preceded PEPE’s strong 2024 expansion and view the token as behaving like leveraged exposure to Ethereum in certain market phases, but this is a structural comparison, not a short-term certainty.
Regulatory catalyst: Canary Capital’s S-1 amendment
A notable fundamental development for U.S. investors arrived when Canary Capital filed an amended registration statement (S-1) for a proposed Canary PEPE ETF on Oct. 2. The initial registration was submitted on April 8; the October amendment updates the existing proposal and indicates continued progress in the filing process.
The preliminary prospectus outlines plans to list shares on Cboe BZX, with BitGo Bank & Trust named as the token custodian. If the registration statement becomes effective, the fund would offer a brokerage-accessible route to PEPE price exposure for U.S. investors. Importantly, the amendment itself is not a fund launch nor a confirmation of future inflows — it represents a procedural step that could become a significant structural catalyst if regulators approve a trading vehicle.
Liquidation zones: upside friction and downside risk
CoinGlass's one-month liquidation heatmap highlights a prominent cluster around $0.00000464, closely aligned with the daily Fibonacci ceiling at $0.00000469. Overhead clusters also appear near $0.0000048 and $0.0000051. A rally into these bands could trigger short-covering liquidations, potentially accelerating upward momentum as forced buys absorb liquidity.
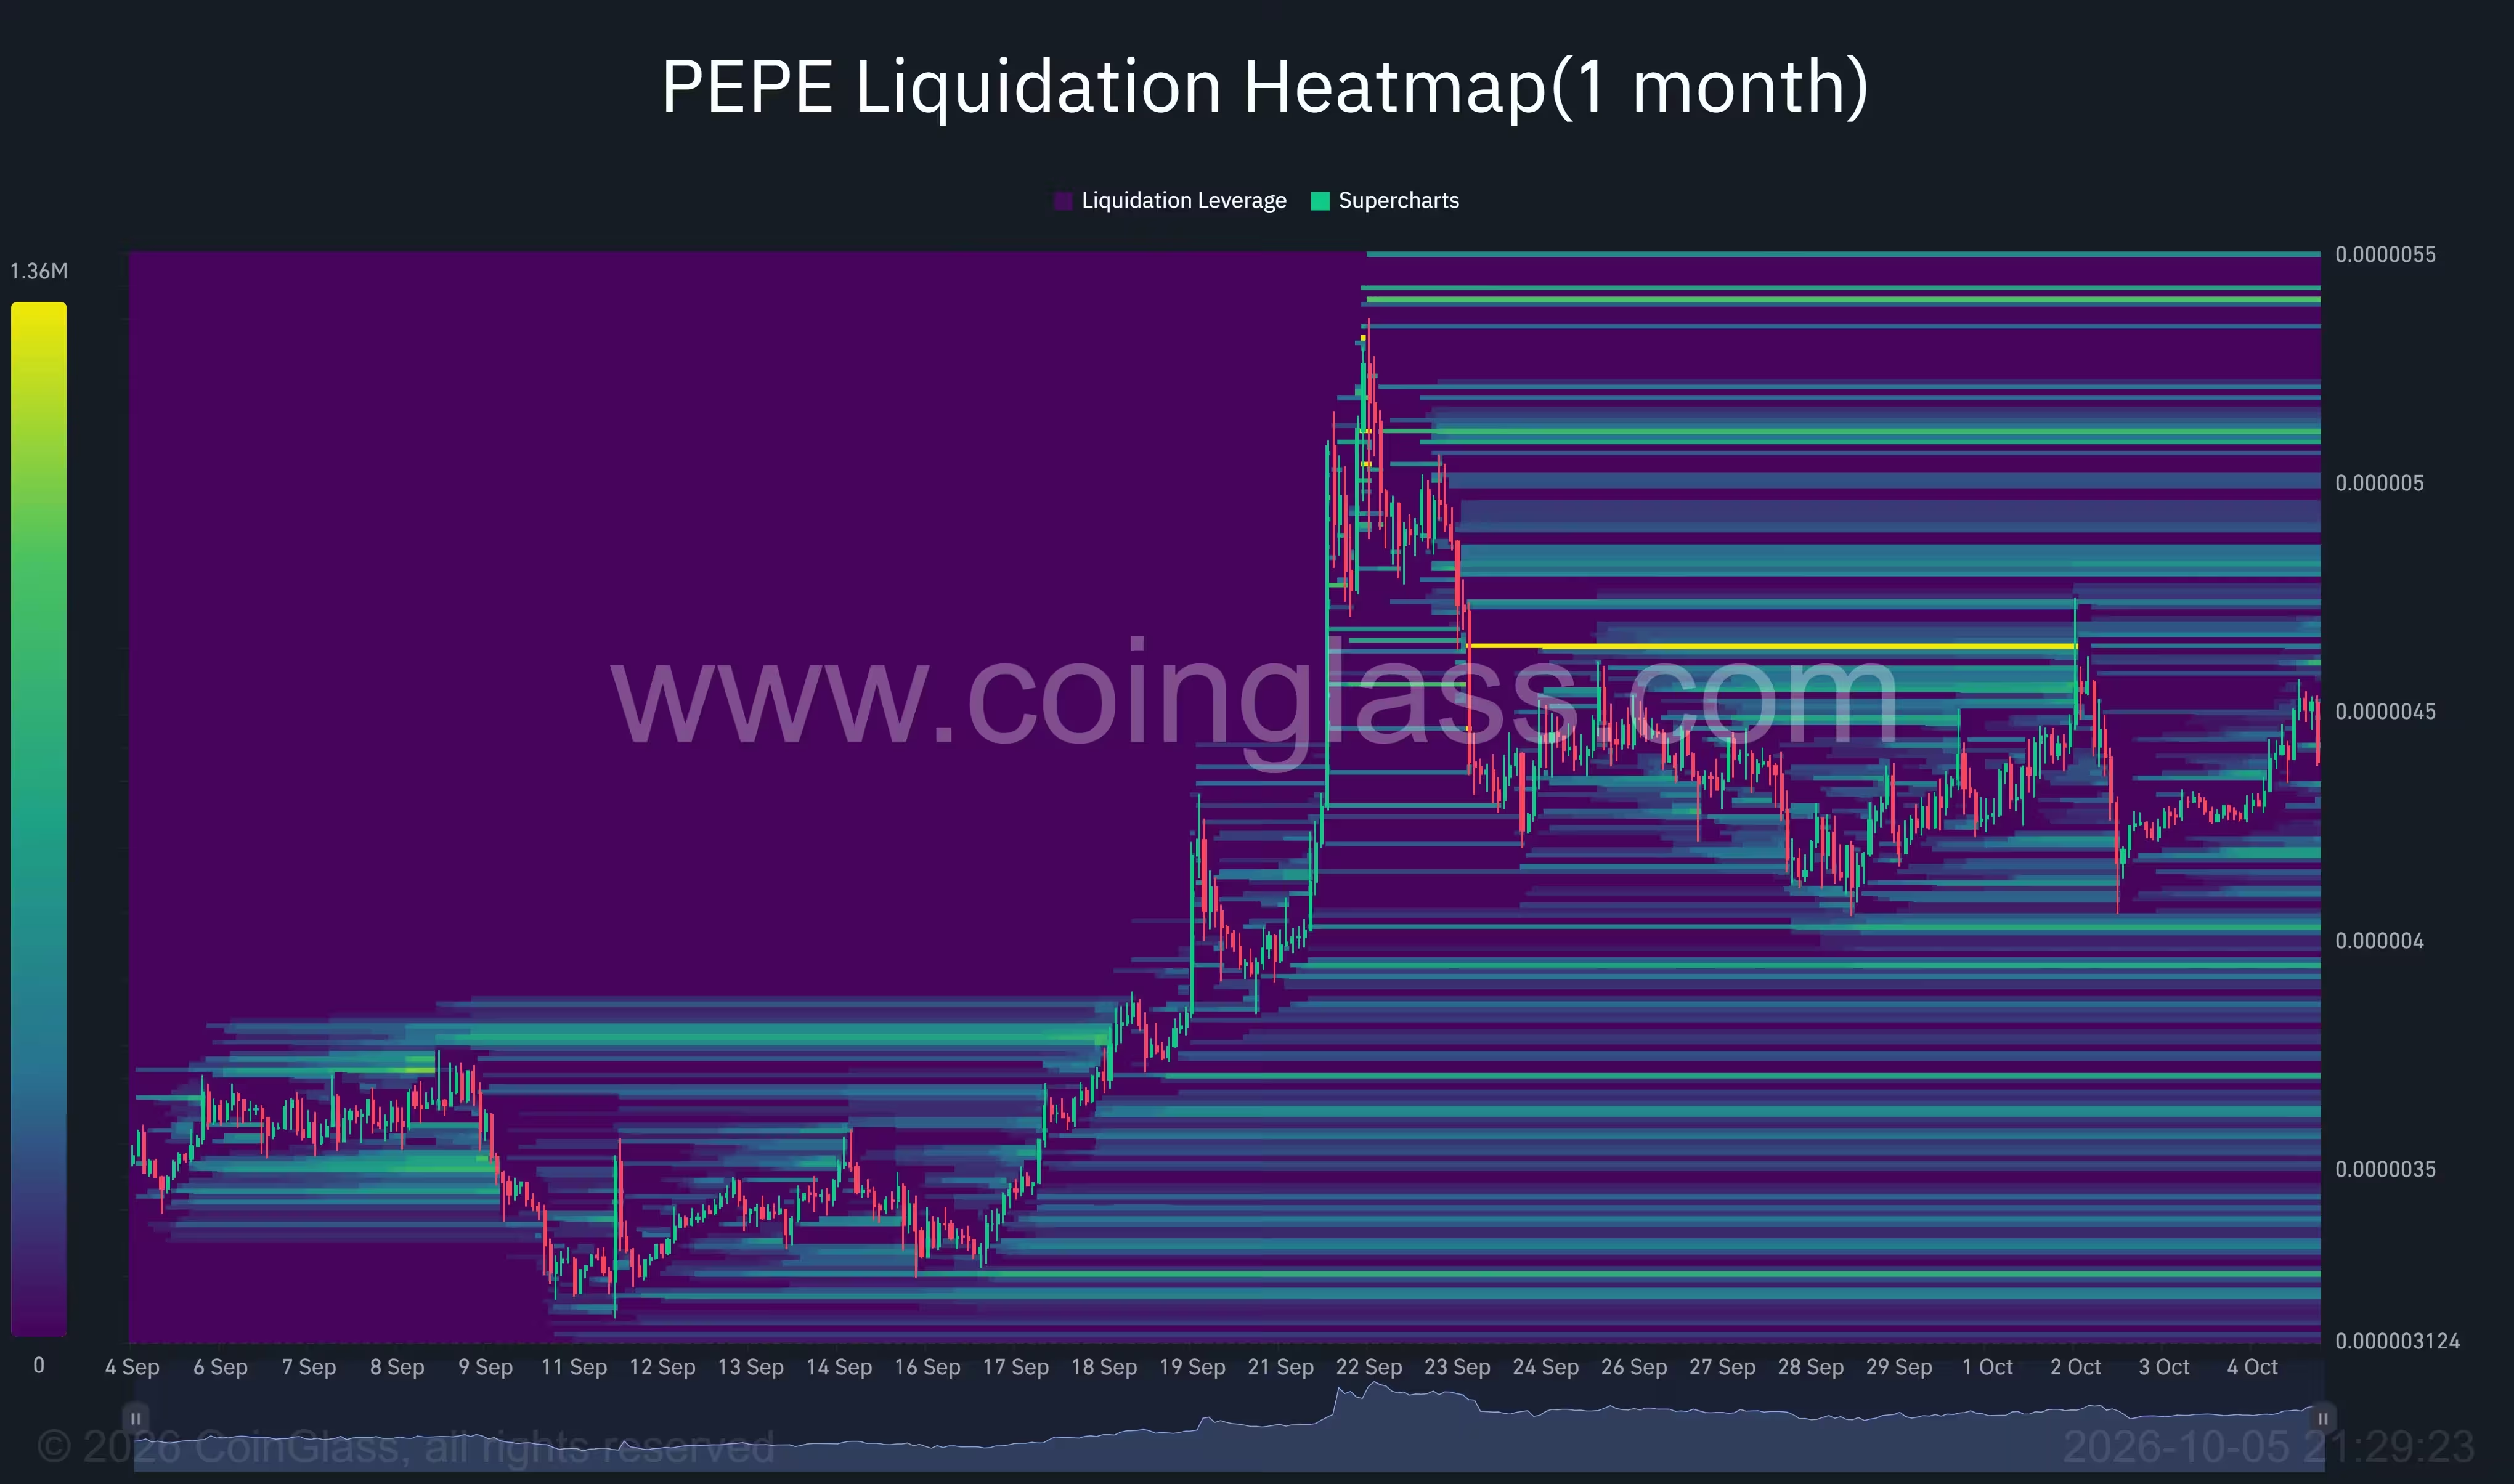
PEPE liquidation heatmap
On the downside, visible liquidation bands lie around $0.0000042 and $0.0000040. A slide toward those levels would increase pressure on leveraged long positions and could generate downward cascades into lower Fibonacci support.
Practically, losing $0.00000417 would compromise the current consolidation and open the 50% retracement at $0.00000380 (about 13.4% below $0.00000439). A deeper drop would expose the 38.2% retracement at $0.00000343 — a decline of roughly 21.9% from the same reference point — effectively erasing a large portion of the recent recovery.
October trade scenarios
Bullish scenario: PEPE defends $0.00000417 and clears the $0.00000469 ceiling. That path would target $0.0000050 and ultimately the September high zone near $0.00000536, with liquidation clusters above providing additional fuel for a breakout if short positions are forced out.
Bearish scenario: PEPE drops below $0.00000417, increasing the odds of a move to $0.00000380 and, if that fails, toward $0.00000343. In this case, leveraged longs would be vulnerable and the recovery from September lows would be materially weakened.
What traders and investors should watch
- Price reaction at $0.00000417 and $0.00000469 (daily Fibonacci boundaries).
- Liquidation heatmap bands near $0.00000464–$0.00000510 for sudden short-covering moves.
- Canary Capital’s ETF filing progress and any SEC feedback that could shift U.S. demand narratives.
- Weekly Chaikin Money Flow and higher-timeframe retest validity to assess whether the wedge breakout has durable volume support.
For October, PEPE's immediate outlook is a balance between a chart-based bullish case that requires defending the lower Fibonacci and clearing the upper band, and a downside scenario that would refocus attention toward mid-$0.0000030s retracements. Traders should combine technical levels, liquidation exposure, and any regulatory developments — including ETF filings — to form a risk-aware view of potential price paths.


Leave a Comment
Comments
No comments yet. Be the first.