
3 Minutes
PEPE market snapshot: sharp decline and price context
PEPE coin has weakened significantly since its September highs, sliding roughly 40% and hitting a six-month low on Oct. 17. The memecoin fell to $0.0000063 before staging a limited rebound to about $0.0000072 at the time of reporting. Year-to-date, PEPE has plunged almost 66% from its earlier peak, placing it among the more volatile altcoins in the current crypto market.
What drove the recent sell-off?
Macro risk-off sentiment
Renewed geopolitical and trade tensions have rippled through risk assets. A notable catalyst in mid-October was U.S. tariff news that pressured markets and coincided with a 33% intraday drop for PEPE to roughly $0.0000062 on Oct. 11. As investors turned risk-averse, several major cryptocurrencies retraced portions of their monthly gains and momentum shifted to the downside.
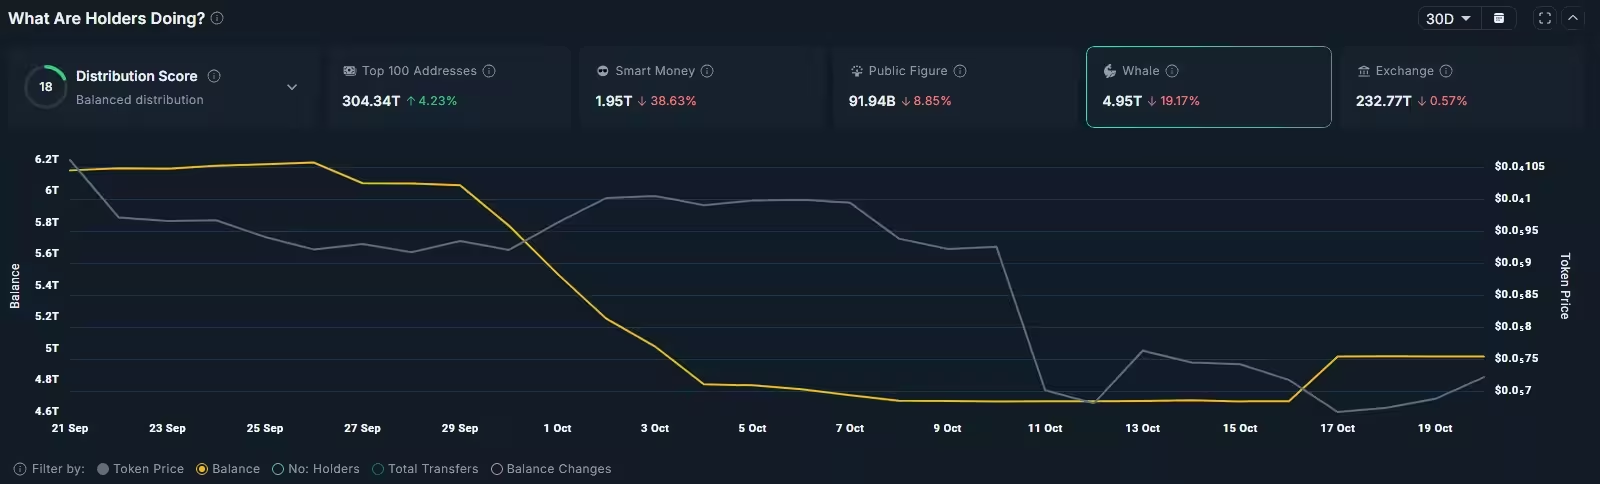
On-chain outflows: whales and smart money
On-chain analytics from Nansen indicate that the price slide has been accompanied by material exits from large holders. Over the past 30 days, tokens held by smart-money wallets fell by around 38.6% to roughly 1.95 trillion PEPE, while whale balances dropped from about 6.13 trillion to 4.95 trillion. These large-scale reductions in concentrated holdings typically signal uncertainty and can amplify downside pressure when retail traders react to volume and price trends.
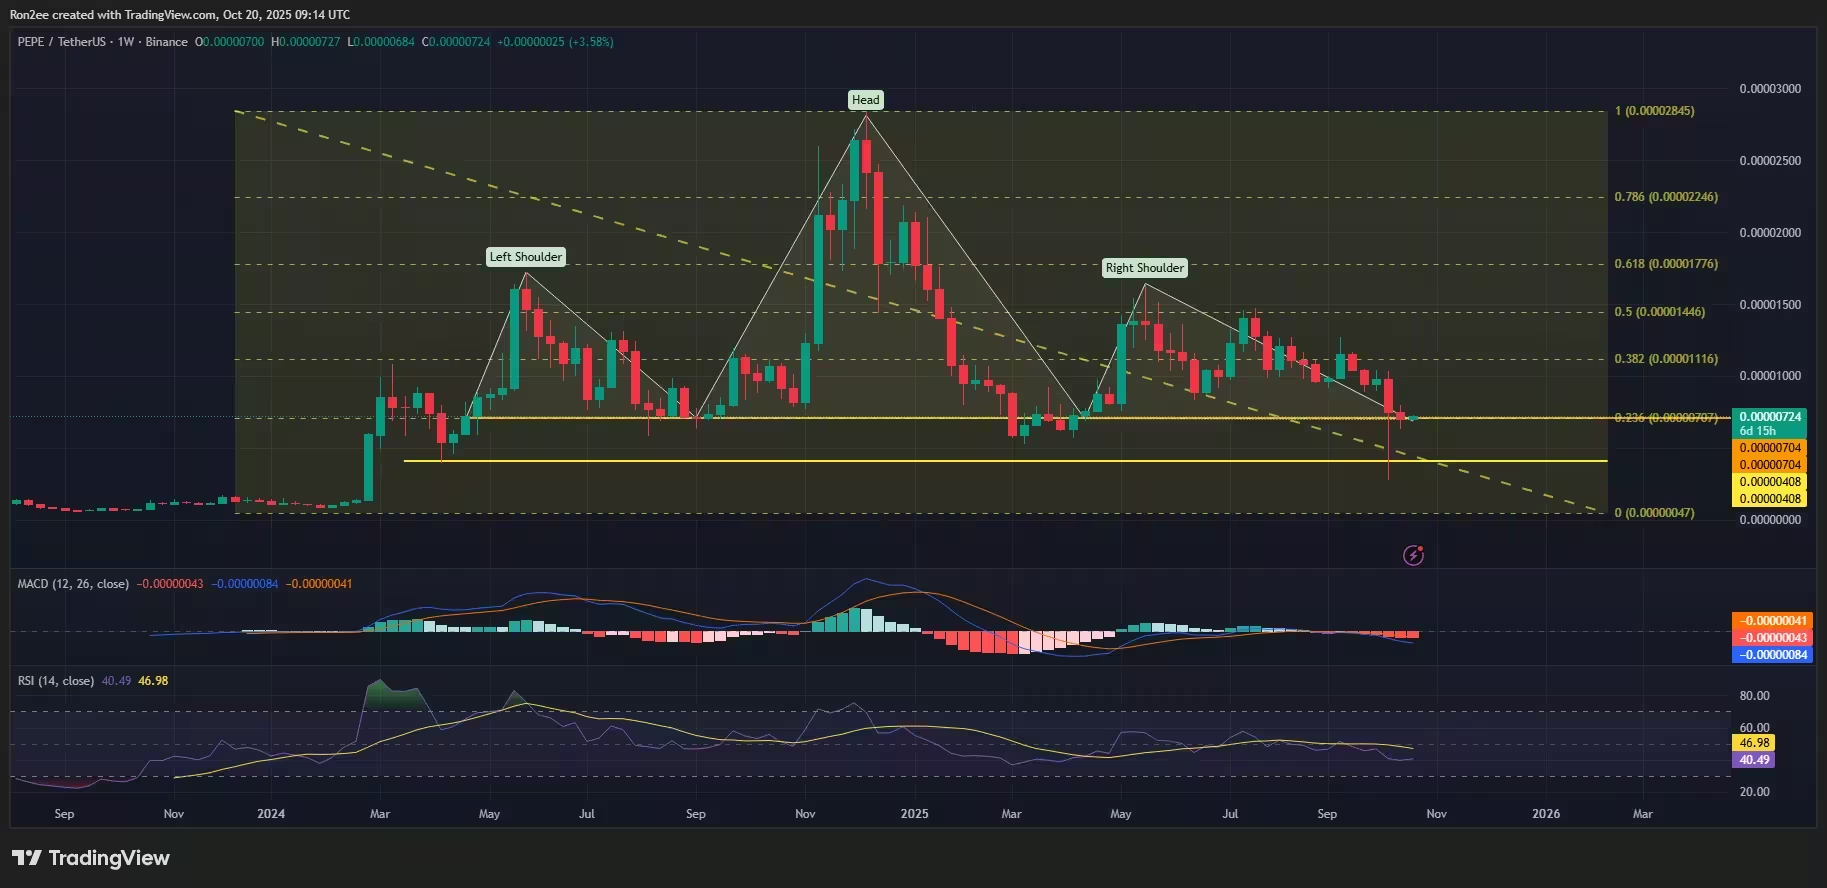
Technical picture: a bearish head-and-shoulders taking shape
Pattern and key levels
On the PEPE/USDT weekly chart, analysts are identifying a textbook multi-year head-and-shoulders formation. The left shoulder, head and right shoulder structure places a critical neckline close to $0.0000070, with the head topping out near $0.000028. This pattern is widely regarded in technical analysis as a potential reversal that, if confirmed by a decisive break of the neckline and accompanying volume, could open the way to deeper losses.
Momentum indicators
Weekly momentum metrics reinforce the cautious outlook. The MACD line has crossed below its signal line, suggesting growing bearish momentum among chart technicians. Meanwhile, the weekly RSI has slipped under the neutral 50 mark, underscoring weakening buying strength. Traders often look for confirmatory volume on a pattern break; rising sell-side volume alongside a breakdown through the neckline would raise the probability of a sustained downtrend.
Possible scenarios and targets
Bear case
If sellers push PEPE decisively below the $0.0000070 neckline with increased volume, technical projections point to a potential move toward $0.0000040 as the next significant support target. Such a decline would likely reflect broader market risk-off conditions and continued distribution from large holders.
Bull case
Conversely, if buyers defend the neckline and reverse momentum, the immediate resistance to watch sits near $0.0000090. A sustained reclaiming of that level, accompanied by stabilizing on-chain flows and improving sentiment, could mark the beginning of a consolidation or recovery phase for this altcoin.
What traders and holders should watch
Indicators and on-chain signals
Market participants should monitor weekly MACD and RSI behavior, trading volume around the neckline, and whale/smart-money wallet balances. A pause in outflows or renewed accumulation by larger wallets would be a constructive sign; continued exits would increase the risk of a deeper correction.
Risk management
Given PEPE’s high volatility, risk management is essential. Traders might use reduced position sizes, tighter stop-losses, or hedging strategies if the neckline breaks. Long-term holders should weigh on-chain accumulation trends and broader crypto market health before adding to positions.
In summary, PEPE’s weekly chart now shows a pronounced head-and-shoulders formation backed by weakening momentum and significant on-chain outflows. A confirmed break below $0.0000070 would favor a bearish path toward lower support, while a successful defense and reclaim of $0.0000090 would improve the recovery outlook.


Leave a Comment
Comments
No comments yet. Be the first.