
5 Minutes
Ethereum slides as liquidations and whale sales accelerate
Ethereum entered its fifth consecutive day of losses, plunging more than 11% in 24 hours and testing multi-month lows. The sharp decline has been driven by a wave of leveraged liquidations, substantial whale selling and growing risk aversion linked to macro developments. With technical indicators flashing bearish and institutional flows turning negative, the market is asking: could ETH drop under the psychological $2,000 mark?
How deep is the current sell-off?
Ether hit an eight-month low, sliding to roughly $2,172 during Asian trading before finding short-term support slightly above $2,200. That move extended ETH's drop to over 25% from its recent high near $3,000 last week. Across the broader crypto market, CoinGlass data show more than $757 million in leveraged positions liquidated in the latest bout of volatility, with long positions bearing the brunt.
Large liquidation events create forced selling pressure as margin calls and automatic deleveraging push more supply into the market. In the past 24 hours, Ethereum long traders saw about $213.59 million wiped out, with nearly $182.34 million of that occurring in the first 12 hours of the sell-off. These numbers follow a weekend spike when roughly $2.4 billion in long positions were liquidated, intensifying trader caution.
Whale behavior and institutional flows
Whales — addresses holding between 10,000 and 1 million ETH — have been offloading significant amounts over the past week, compounding downward pressure. On-chain analytics from Santiment indicate these large holders sold billions of dollars worth of ETH, a signal that often precedes sharper corrections.
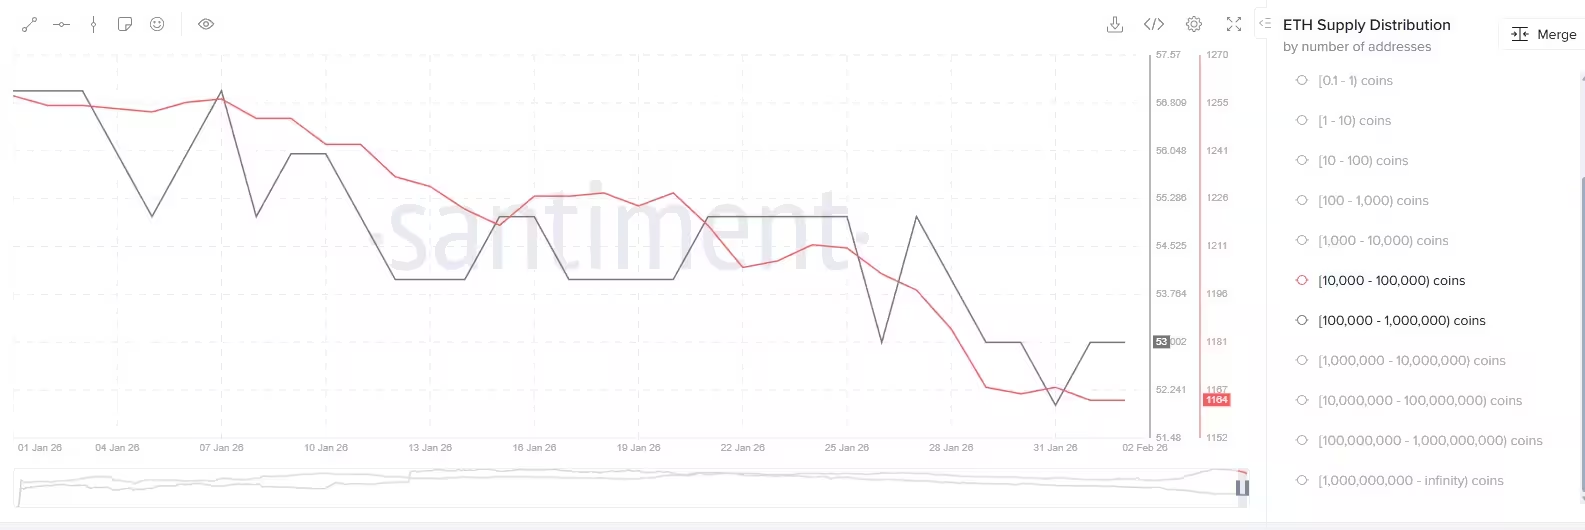
Whales have been selling ETH over the past week
Institutional demand has also cooled: Ethereum exchange-traded funds recorded nearly $327 million in outflows over the same period as some managers cut exposure amid the market rout. ETF withdrawals can amplify retail anxiety, triggering further selling and deeper drawdowns in the short term.
Macro forces and sentiment
Beyond crypto-specific drivers, macro events have dented risk appetite. The nomination of Kevin Warsh for the Federal Reserve chair — viewed as hawkish by many market participants because of his prior calls for monetary discipline — shifted expectations for tougher policy. Meanwhile, a partial U.S. government shutdown created a data and regulatory vacuum that added to investor uncertainty.
These developments pressured both Bitcoin and Ethereum simultaneously, reducing appetite for leveraged crypto positions and higher-beta assets.
Technical outlook — are bearish patterns confirmed?
On the daily chart, ETH has broken down from a rising wedge — a classic bearish reversal pattern. After that breakdown, price also slipped beneath the neckline of a larger inverse cup-and-handle pattern that had been forming since mid-2025. Inverse cup-and-handle structures often signal continuation of longer-term declines when confirmed.
Ethereum price has confirmed multiple bearish patterns on the daily chart — Feb. 2
Momentum indicators add weight to the downside bias. The MACD is trending lower, and the RSI has moved into oversold territory. While an oversold RSI can precede short-term bounces, any rally may be limited if selling pressure from liquidations and whale distributions persists. The Crypto Fear & Greed Index currently sits at 14, reflecting extreme fear across the market.
Key levels and scenarios
- Bearish scenario: Continued liquidation cascades, renewed whale selling or further ETF outflows could push ETH below the $2,000 psychological support. A break under $2,000 may invite additional stop-losses and deeper downside toward prior demand zones.
- Neutral/bullish scenario: If forced selling abates and buyers step in near the $2,100–$2,200 area, ETH could stabilize and stage a relief rally. However, any recovery would likely require a halt in long liquidations, renewed institutional inflows and improvement in macro sentiment.
Traders and investors should monitor on-chain metrics, liquidation data, ETF flows and macro headlines closely. Leveraged exposure remains particularly vulnerable while volatility and negative sentiment dominate.
Takeaway
Ethereum's recent collapse reflects a confluence of market mechanics: heavy long liquidations, coordinated whale sales and weakening institutional demand, all occurring against an uncertain macro backdrop. Technical patterns and momentum indicators currently favor further downside, making a breach of $2,000 a realistic risk if selling pressure endures. For now, cautious risk management and attention to liquidation and flow data are essential for anyone trading or investing in ETH and broader crypto markets.
Source: crypto
Comments
DaNix
Wait, ETFs pulling out $327m? Is that really the trigger or just a scapegoat? feels like missing piece
blockflux
wow didnt see this coming, whales selling like crazy. Is 2k next? feels brutal rn...
Leave a Comment