4 Minutes
XRP tumbles to lowest level since April amid market sell-off
Ripple's native token XRP plunged to $1.5000, marking the lowest price since April of last year and wiping out roughly 55% from its 2025 peak. The decline accelerated as the broader crypto market sold off: Bitcoin fell below the $80,000 support level and many altcoins are trading more than 50% under their all-time highs. The rout has triggered widespread liquidations and renewed investor anxiety across exchanges and spot funds.
Liquidations surge and spot XRP funds post outflows
On-chain and derivatives data show a dramatic spike in forced position closures. CoinGlass reports that total crypto liquidations jumped 357% in 24 hours to exceed $2.58 billion. Ethereum traders suffered over $1.15 billion in liquidations, Bitcoin positions totaling about $785 million were wiped out, and XRP long and short positions saw roughly $61 million liquidated in the same 24-hour window.
Spot XRP funds also experienced outflows: the latest weekly figures show these funds shed more than $52 million last week after losing about $40 million the week before. Despite the recent withdrawals, spot XRP funds have accumulated around $1.18 billion in cumulative inflows since launch, underscoring sustained institutional interest even amid volatility.
Market sentiment falls to extreme fear
Investor psychology has deteriorated sharply. The Crypto Fear and Greed Index plunged into the extreme fear zone at 18, a level that historically correlates with heightened selling pressure and short-term price bottoms. When sentiment registers extreme fear, risk-averse traders often exit positions, amplifying downside moves across the market.
XRP technical picture: hammer candle offers short-term hope
Technical indicators show XRP has broken below key supports. The daily chart traces a decline from a July high of $3.6622 to the current $1.5000 low. The token fell beneath the important $1.7920 support — a level that served as a floor through October to December last year — signaling bearish control in recent weeks.
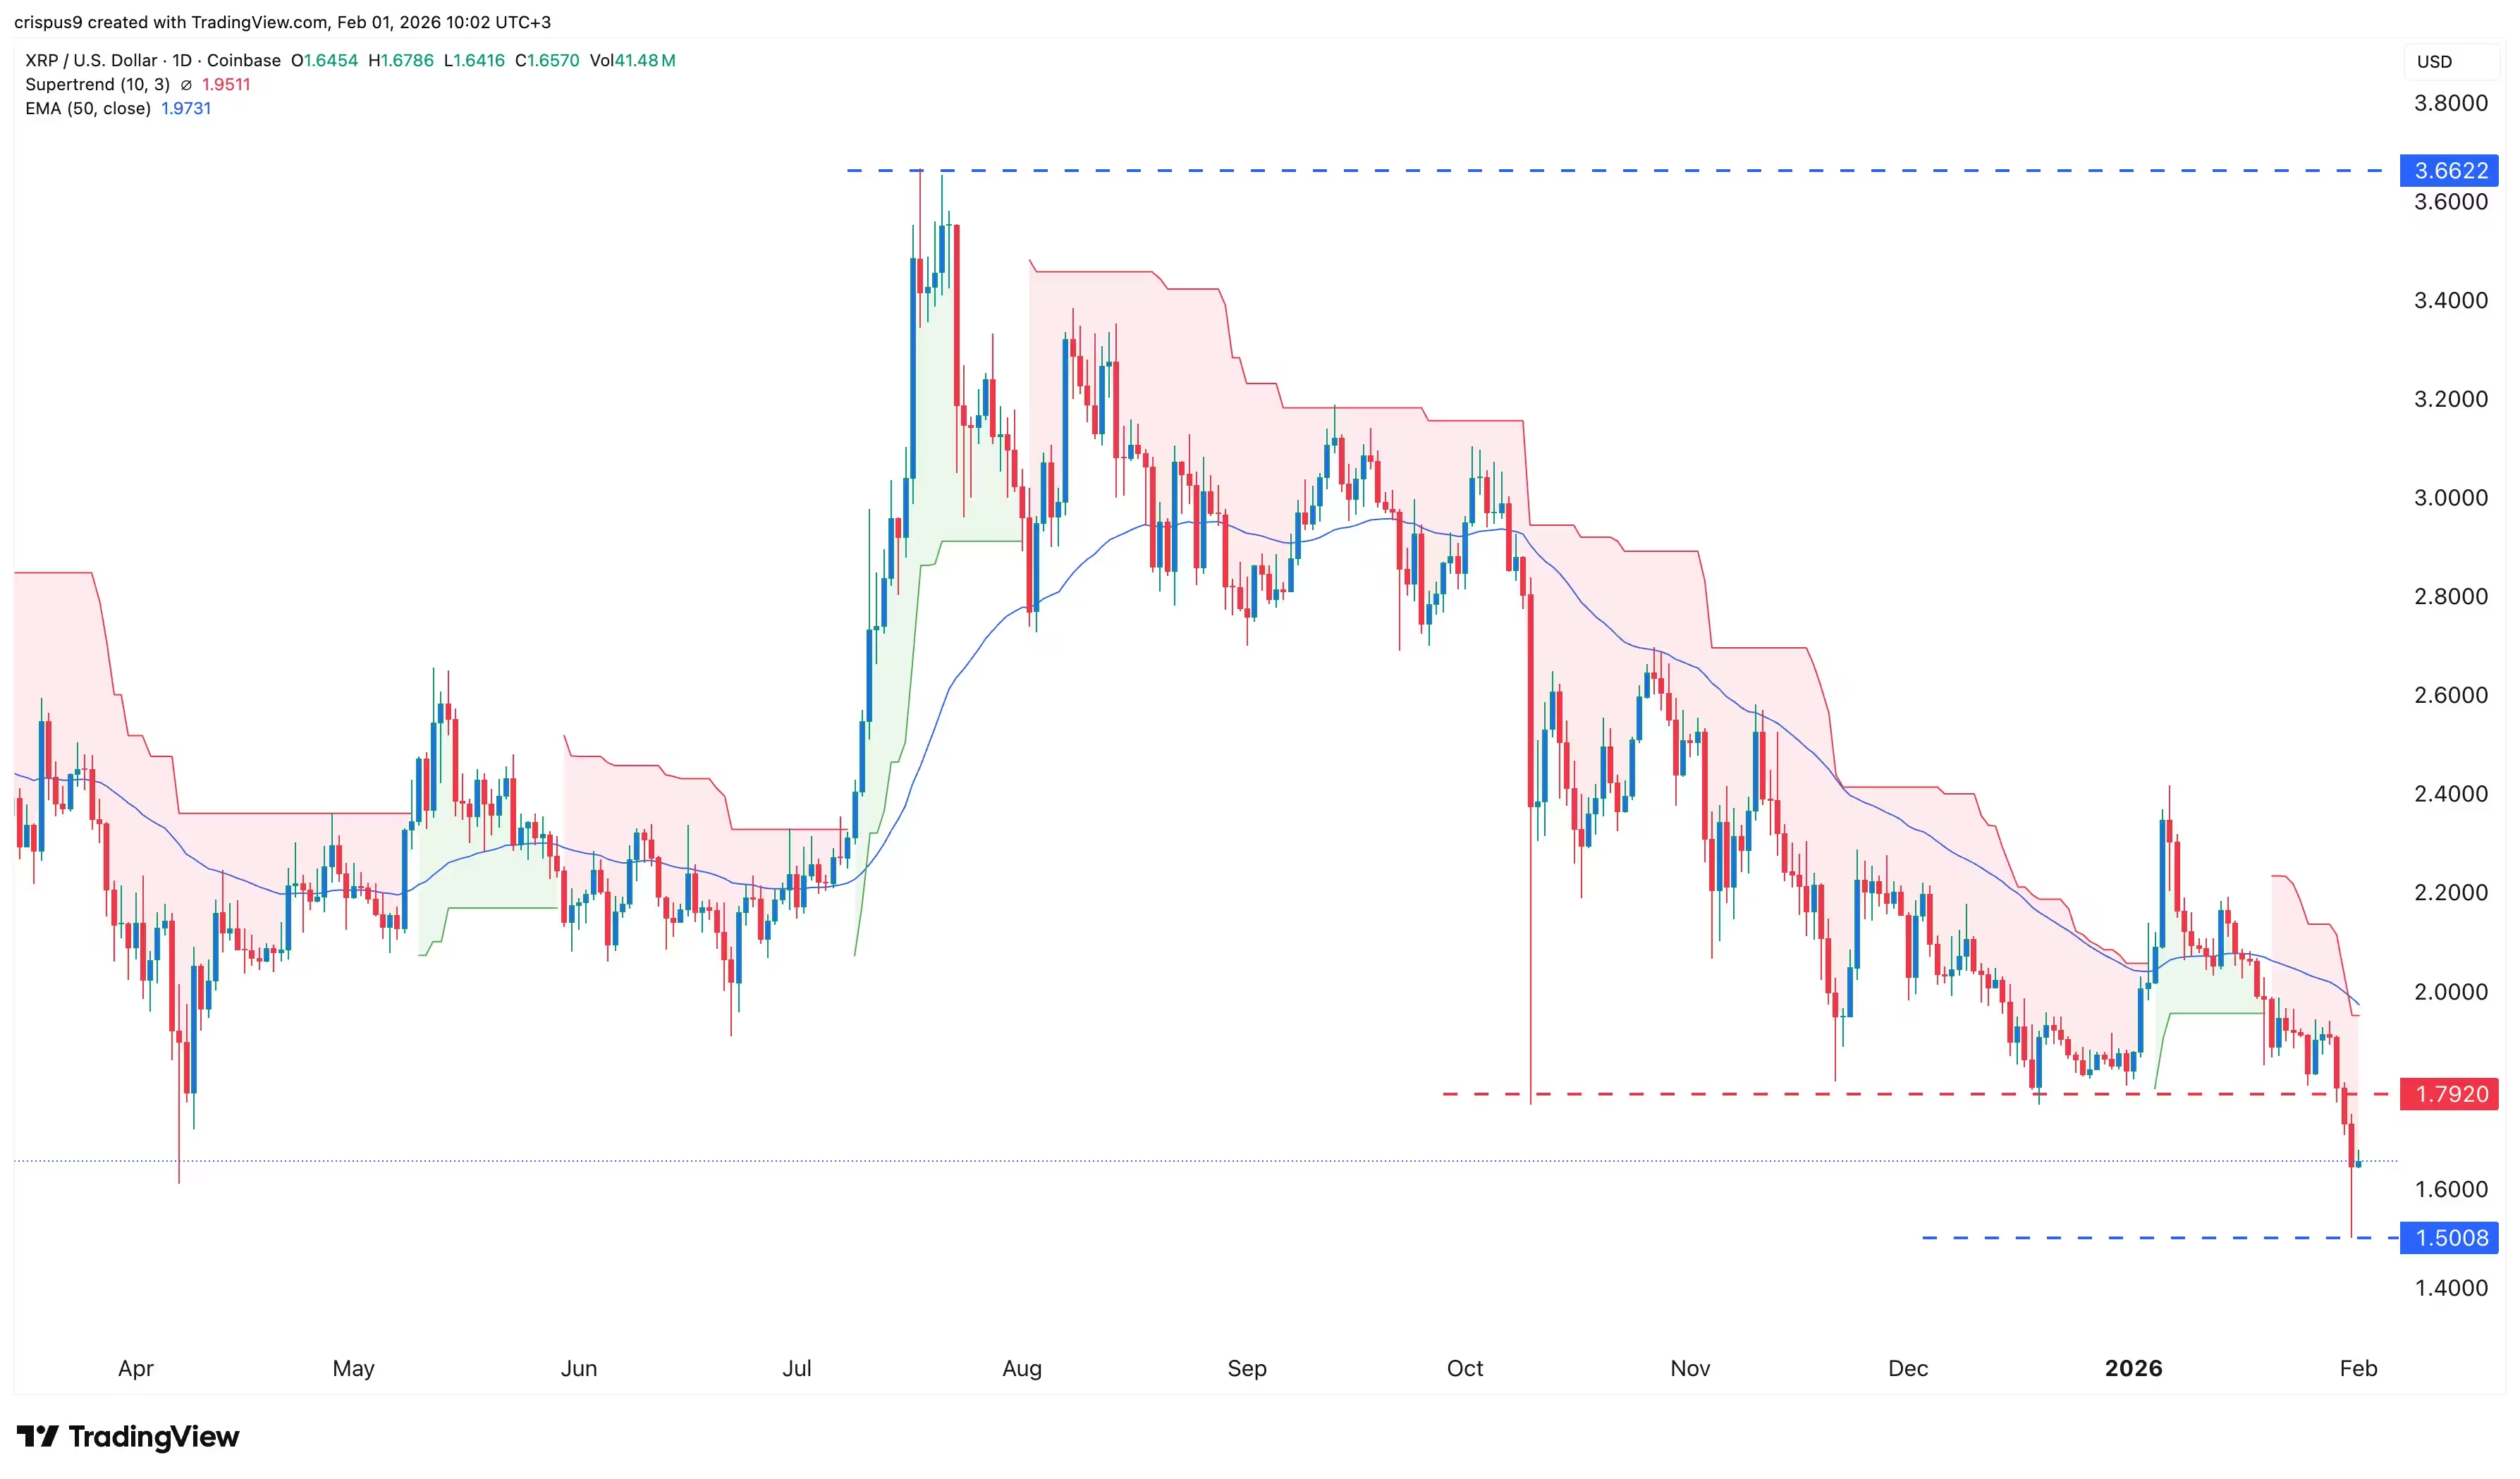
Ripple price chart
Bullish reversal signal
Despite the downtrend, XRP formed a hammer candlestick on the daily timeframe, characterized by a long lower shadow and a compact body. A hammer is a common bullish reversal pattern, suggesting a possible short-term bounce as buyers step in following heavy selling. If the rebound unfolds, XRP could retest the $1.7920 area — roughly 9% above current levels — in a break-and-retest move.
What confirms a sustainable recovery?
For a more convincing trend change, XRP needs to climb above the 50-day moving average and retake the Supertrend indicator on the daily chart. Remaining below major moving averages and the Supertrend keeps the medium-term bias bearish; a successful break above these technical layers would validate a broader recovery and reduce immediate downside risk.
Outlook for traders and investors
Short-term traders should watch liquidation clusters and sentiment readings closely, as further forced selling could pressure prices lower. Longer-term investors may view the hammer candle and reduced price levels as potential buying opportunities, but should consider risk management given macro volatility and market-wide deleveraging. Key metrics to monitor include spot fund flows, total liquidations, BTC and ETH price action, and whether XRP can reclaim the $1.7920 level alongside rising moving averages.
Source: crypto
Leave a Comment