
4 Minutes
Market snapshot: Bitcoin dips under $110,000
Bitcoin has slipped below the $110,000 mark, trading around $109,399 as of the latest update. The move accompanies a sharp fall in the Crypto Fear and Greed Index, which dropped to 29 — positioning the market firmly in a state of Fear and edging closer to Extreme Fear territory. Crypto traders and investors are watching price action closely after a week of heavy liquidations that pushed the overall crypto market cap down to roughly $3.8 trillion.
What the Fear and Greed Index reveals
The Crypto Fear and Greed Index lost 16 points in 24 hours, according to CoinGlass data. That deterioration reflects widespread selling across major tokens and recent liquidation events that erased earlier gains. Historically, the index has flashed Extreme Fear during periods of rapid market stress — for example in April 2025 and mid-February 2025, when blanket tariffs tied to political developments caused abrupt volatility.
Market breadth: BTC and ETH under pressure
Both Bitcoin (BTC) and Ethereum (ETH) are down roughly 2% in the latest session. Ethereum slipped below the $4,000 gate again, while Bitcoin’s pullback brings it below $110,000 after failing to reclaim pre-liquidation levels that had been above $117,000. The broader crypto market cap has settled near $3.8 trillion, down about 2% on the day.
Short-term technicals: moving averages and RSI
BTC is trading under the 30-period moving average, near $109,526, which acts as immediate resistance. The 30-day MA is now a key technical barrier: a sustained move back above it could open a path to test the $109,700–$109,800 zone.
Relative Strength Index (RSI)
Bitcoin’s RSI sits near 35 — approaching oversold territory but not yet signaling a capitulation. That suggests short-term selling pressure remains, but it also leaves room for a relief bounce if buyers step in at these levels.
Intraday support and resistance
Immediate support lies in the $109,200–$109,000 range, which has provided short-term stability during recent intraday declines. A decisive break below $109,000 could expose BTC to a deeper pullback toward $108,800 or lower. Conversely, reclaiming and holding above the 30-period moving average at $109,526 would improve the technical outlook and raise the probability of retesting $109,700–$109,800.
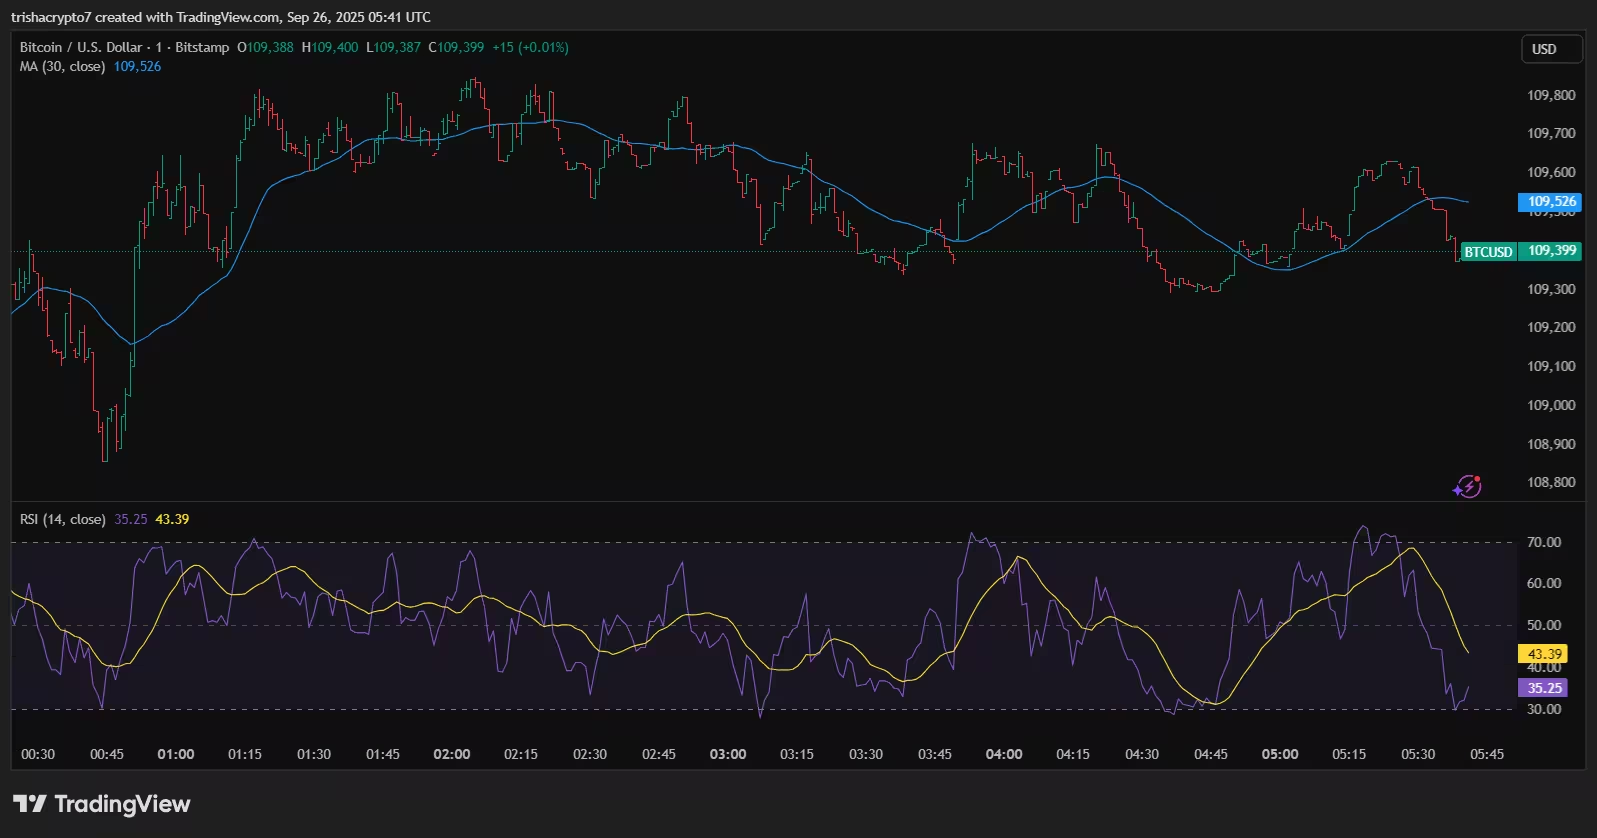
Bitcoin price chart and the 30-day moving average
Scenarios traders should consider
There are two primary near-term scenarios for market participants:
- Bearish continuation: If selling volume increases and the RSI continues downward momentum, Bitcoin could test the lower intraday support band ($109,200–$109,000). A break of these levels on elevated volume would likely lead to further liquidation and a probe toward $108,800 or lower. The market’s heightened Fear reading increases the probability of sudden moves.
- Short-term rebound: If buyers defend the $109,000 region and the RSI begins to recover, BTC could stage a relief rebound. A clear push above the 30-day MA at $109,526 would be a bullish technical signal in the short term and may prompt a retest of the $109,700–$109,800 resistance zone.
Macro catalysts and market risk
Recent episodes of volatility have been amplified by macro and policy-driven events. Notably, tariff announcements and geopolitical headlines have previously rattled crypto markets, driving sharp turns in investor sentiment. With the Fear and Greed Index in the low 20s–30s range, external shocks or large forced liquidations could accelerate downside risk.
What this means for investors and traders
For long-term investors, current conditions may present buying opportunities if fundamentals remain intact and one can tolerate short-term volatility. Traders should prioritize risk management: tighten stop-losses, size positions according to risk tolerance, and monitor liquidity and leverage levels across derivatives platforms to avoid unexpected liquidations.
- Traders looking to scalp or day-trade should watch the 30-period moving average and intraday support bands.
- Swing traders seeking a rebound trade may wait for confirmation above the 30-day MA and an RSI recovery before entering.
Key takeaways
Bitcoin’s move below $110,000 coincides with accelerated fear in the market, as reflected by the Crypto Fear and Greed Index falling to 29. Technical indicators signal short-term bearish momentum, but a controlled bounce remains possible if BTC clears the 30-day moving average and RSI stabilizes. The broader crypto market cap has been trimmed to about $3.8 trillion following recent liquidations, and both BTC and ETH are trading lower by roughly 2%.
Traders and investors should stay alert to shifting sentiment and manage position sizes accordingly. With the market near Fear territory, quick reversals are possible — meaning timely entries and disciplined exits will be essential for navigating the next moves in Bitcoin and the wider crypto market.


Leave a Comment
Comments
No comments yet. Be the first.