
5 Minutes
Bitcoin edges higher as forced liquidations fade
Bitcoin (BTC) nudged up on Feb. 3 after a pronounced sell-off that pushed prices to levels not seen since April 2025. The pullback relieved immediate pressure from forced liquidations, while U.S. spot Bitcoin ETFs posted their first net inflows in five days — a signal that fresh capital may be re-entering the market.
At the time of writing, Bitcoin was trading around $78,659, up roughly 3.8% from the prior session after touching lows near $75,400. Despite the intraday bounce, BTC remains under strain: down about 11% over the past seven days and almost 40% from the October 2025 high near $126,080. That combination underlines the depth of the recent correction and the still-dominant bearish sentiment.
ETF inflows return as dip buyers step in
One of the more encouraging developments on Feb. 3 came from spot Bitcoin ETFs. According to SoSoValue, these funds recorded net inflows of approximately $561.89 million, breaking a five-day streak of withdrawals. BlackRock’s IBIT, Fidelity’s FBTC and Bitwise’s BITB were among the leading issuers drawing fresh capital.
Why ETF inflows matter: unlike derivative flows, spot Bitcoin ETFs represent direct demand for BTC exposure. When institutional buyers allocate into ETFs, it tends to soak up available supply and can provide a stabilizing effect during volatile sell-offs. While a single session of inflows doesn’t confirm a new uptrend, the return of ETF demand suggests some institutions view current prices as attractive entry points.
Futures and funding dynamics
On the futures side, metrics point to a more cautious reopening of positions rather than a fresh surge of leverage. CoinGlass data showed total futures volume eased by roughly 18.7% to $78.9 billion, while open interest ticked up modestly to about $52.19 billion — a mix that often signals traders are re-establishing exposure without amping up leverage.
Funding rates further illustrate the market backdrop. CryptoQuant contributor CryptoNiel noted consecutive days of negative funding, a fingerprint of short-dominant futures markets. Persistently negative funding can indicate heavy short positioning; it can also create buying opportunities for contrarian or short-term traders if the market becomes oversold.
Technical picture: relief rally, not yet a trend reversal
Technically, Bitcoin shows signs of exhaustion after the sharp decline, but sellers still hold the upper hand. Key indicators to watch:
- Relative Strength Index (RSI): BTC’s daily RSI fell below 30, entering oversold territory. Historically, oversold RSI readings often precede short-term recoveries, even in broadly negative trends.
- Bollinger Bands: Price has been riding the lower Bollinger Band, signaling strong downward momentum. If selling cools, a move back toward the mid-band is possible; however, that would constitute a relief rally rather than a confirmed bullish reversal.
- Moving averages: BTC remains under both the 20-day and 50-day moving averages. Any meaningful rebound is likely to encounter resistance in the $82,000–$85,000 range, which previously acted as support before the breakdown.
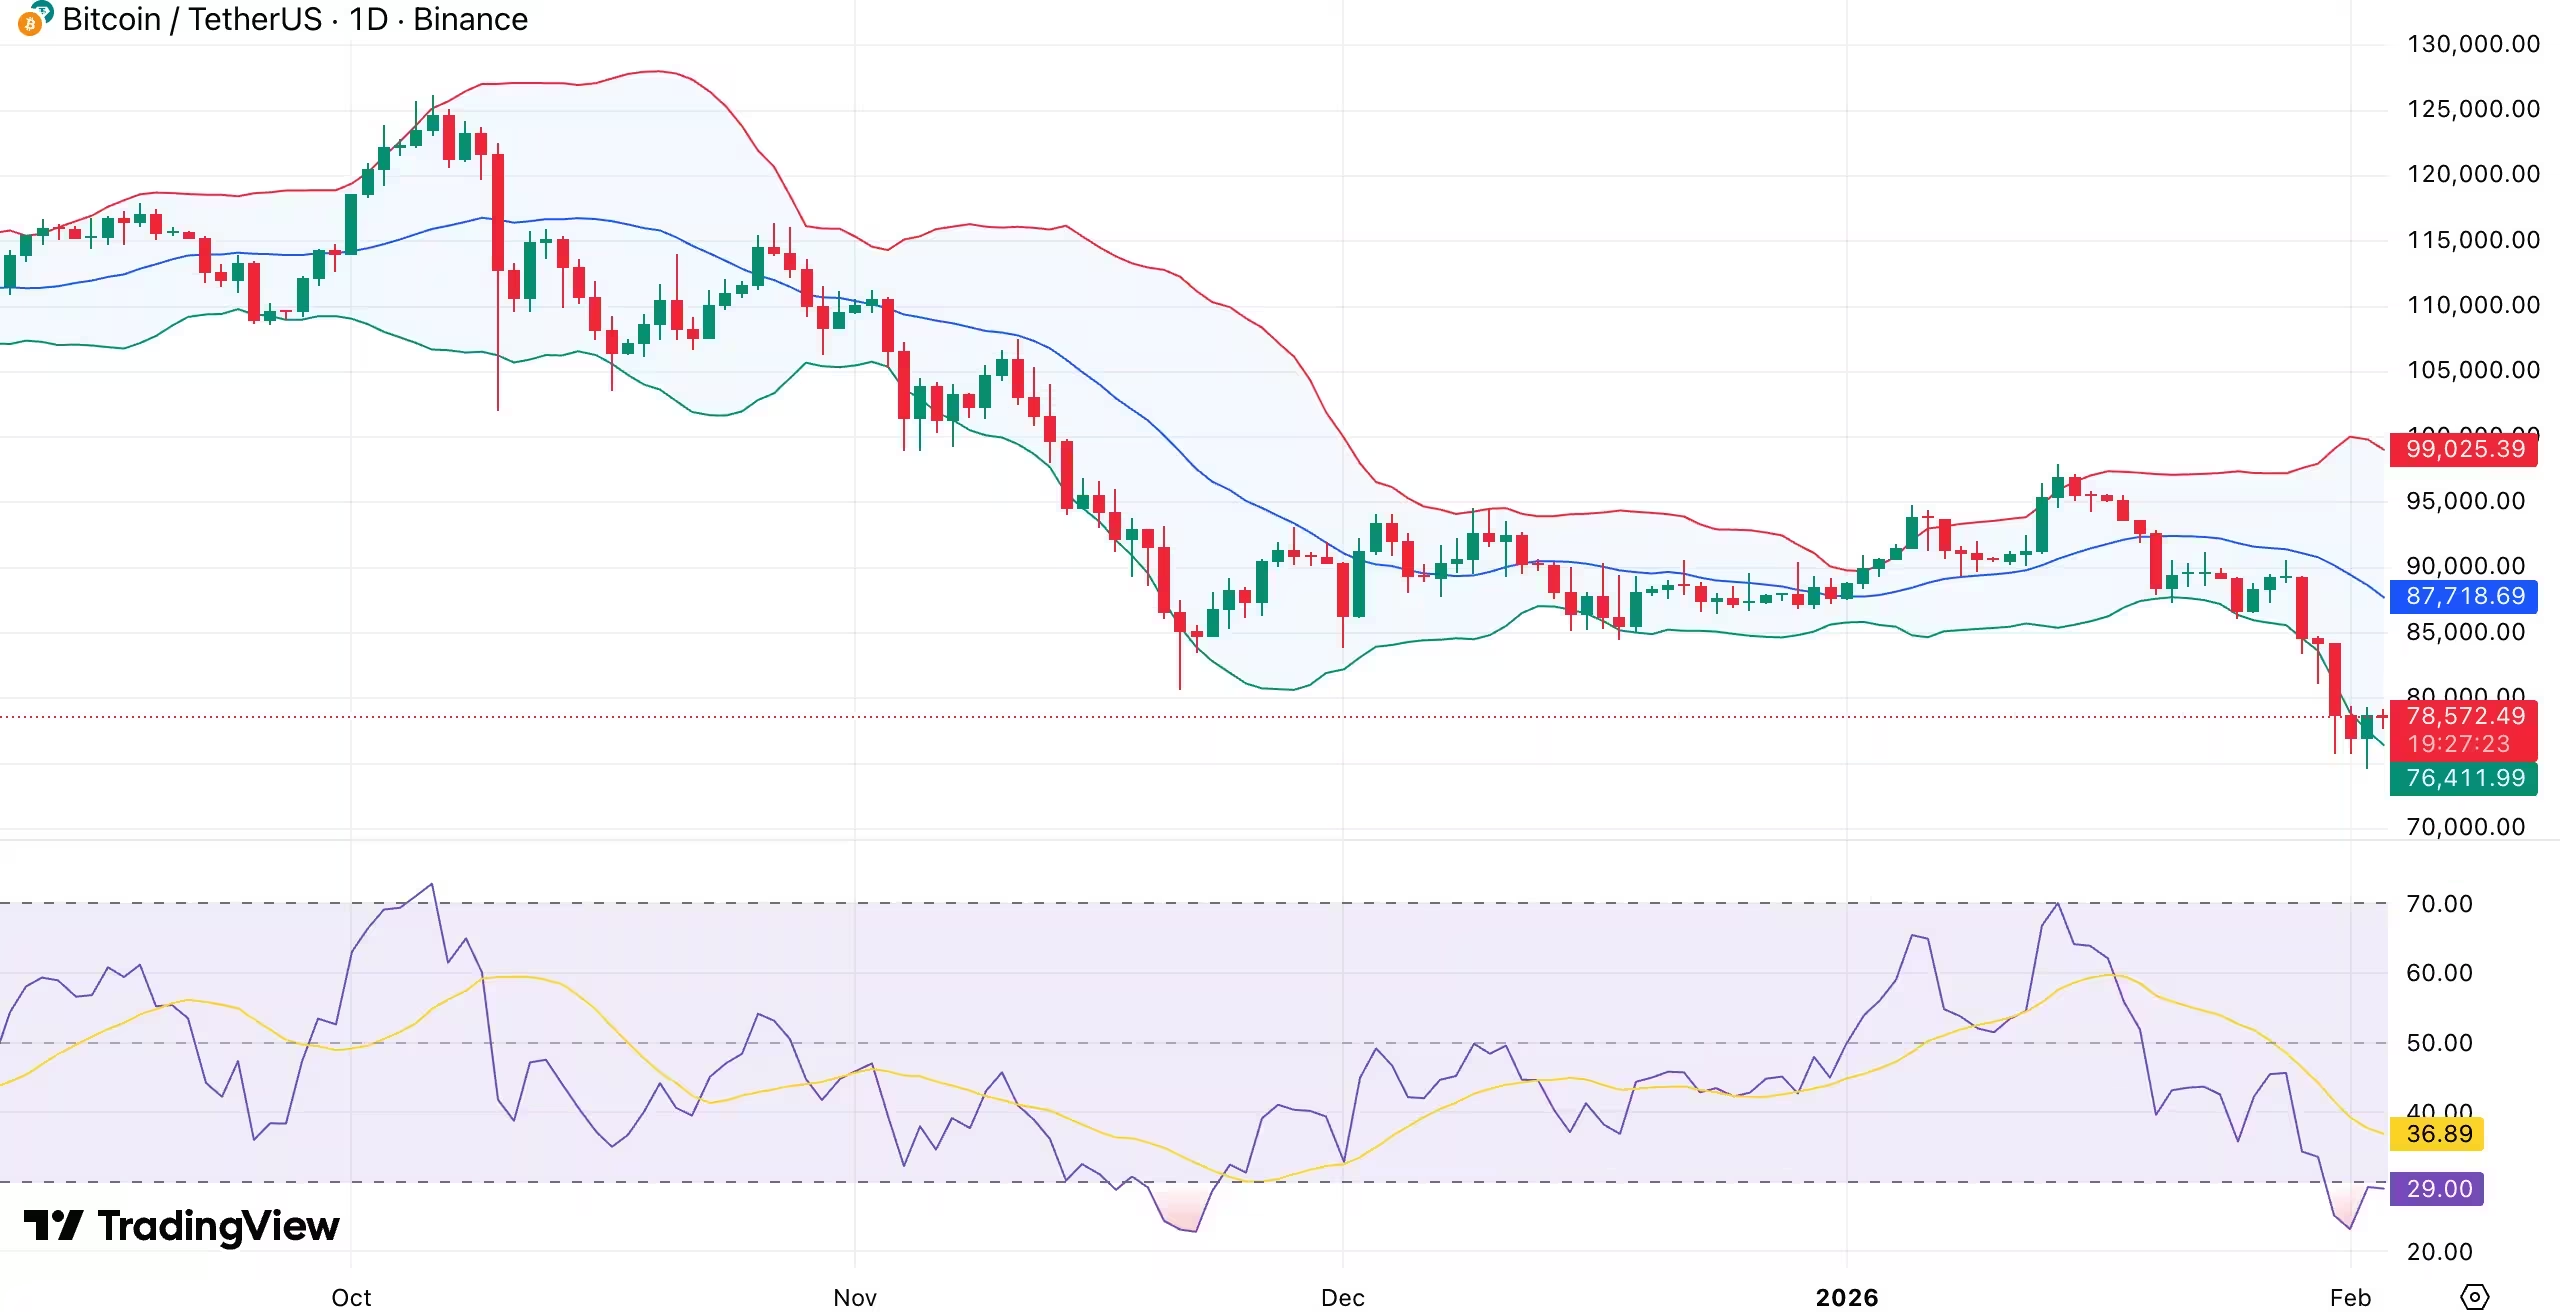
Bitcoin daily chart
Structurally, the chart is still printing lower highs and lower lows. Buyers have shown interest around the $76,000–$78,000 demand zone, but a decisive close below that area would risk accelerating losses. Conversely, if downward momentum continues to stall, traders may start to see a bullish RSI divergence — a potential early sign of consolidation or a shallow bottom forming.
Key levels and market risks
Short-term resistance: $82,000–$85,000 (20-day/50-day moving averages and prior support)
Immediate support: $76,000–$78,000 demand zone
Additional technical watch: the CME gap near $84,000 remains an upside magnet for some traders, but the market has struggled to reclaim that area since the drop. Narrowing Bollinger Bands after rapid expansion suggests volatility may decline and the market could transition into a consolidation phase.
What traders should monitor next
- ETF flows: sustained or growing spot Bitcoin ETF inflows would be a constructive signal for price support and indicate institutional accumulation.
- Funding and open interest: a stabilization or normalization in funding rates and a balanced open interest could imply fewer forced liquidations and a healthier market structure.
- On-chain signals: wallet activity, exchange outflows, and large holder behavior will provide context on whether the bounce is driven by genuine accumulation or short-covering.
In summary, Feb. 3’s bounce reflects short-term relief driven by reduced liquidation pressure and renewed ETF demand. Technicals point to an oversold BTC that could rally back toward the $82k–$85k resistance band, but the prevailing downtrend and structural lower highs keep the odds tilted toward consolidation or further downside until clearer signs of trend reversal appear. Traders and investors should watch ETF inflows, funding rates, and support at the mid-$70k range for confirmation of any sustained recovery.
Source: crypto
Comments
Armin
nice bounce, but not a bull signal yet. RSI oversold, buyers at 76k, resistance 82-85k. watching for a close below 76k - then things get ugly
arkcoin
ETF inflows today ok, but is that real demand or just shorts covering? Negative funding, lower highs... feels fragile, could fade fast
Leave a Comment