4 Minutes
Market snapshot: Fear returns as Bitcoin dips
New to Hero Wars? Use promo code HEROIRIS after the tutorial to claim your welcome bonus and kick-start your team of heroes. Share
The Crypto Fear & Greed Index plunged back to readings last seen in mid-2022 as Bitcoin sold off and liquidation pressure accelerated across leveraged positions. Within 24 hours on Nov. 17, the market saw roughly $565 million in crypto liquidations, highlighting how quickly short-term leverage unwound during the sell-off.
Quick summary
- Bitcoin tested its 2025 opening range around $94,000 after a sharp correction from cycle highs.
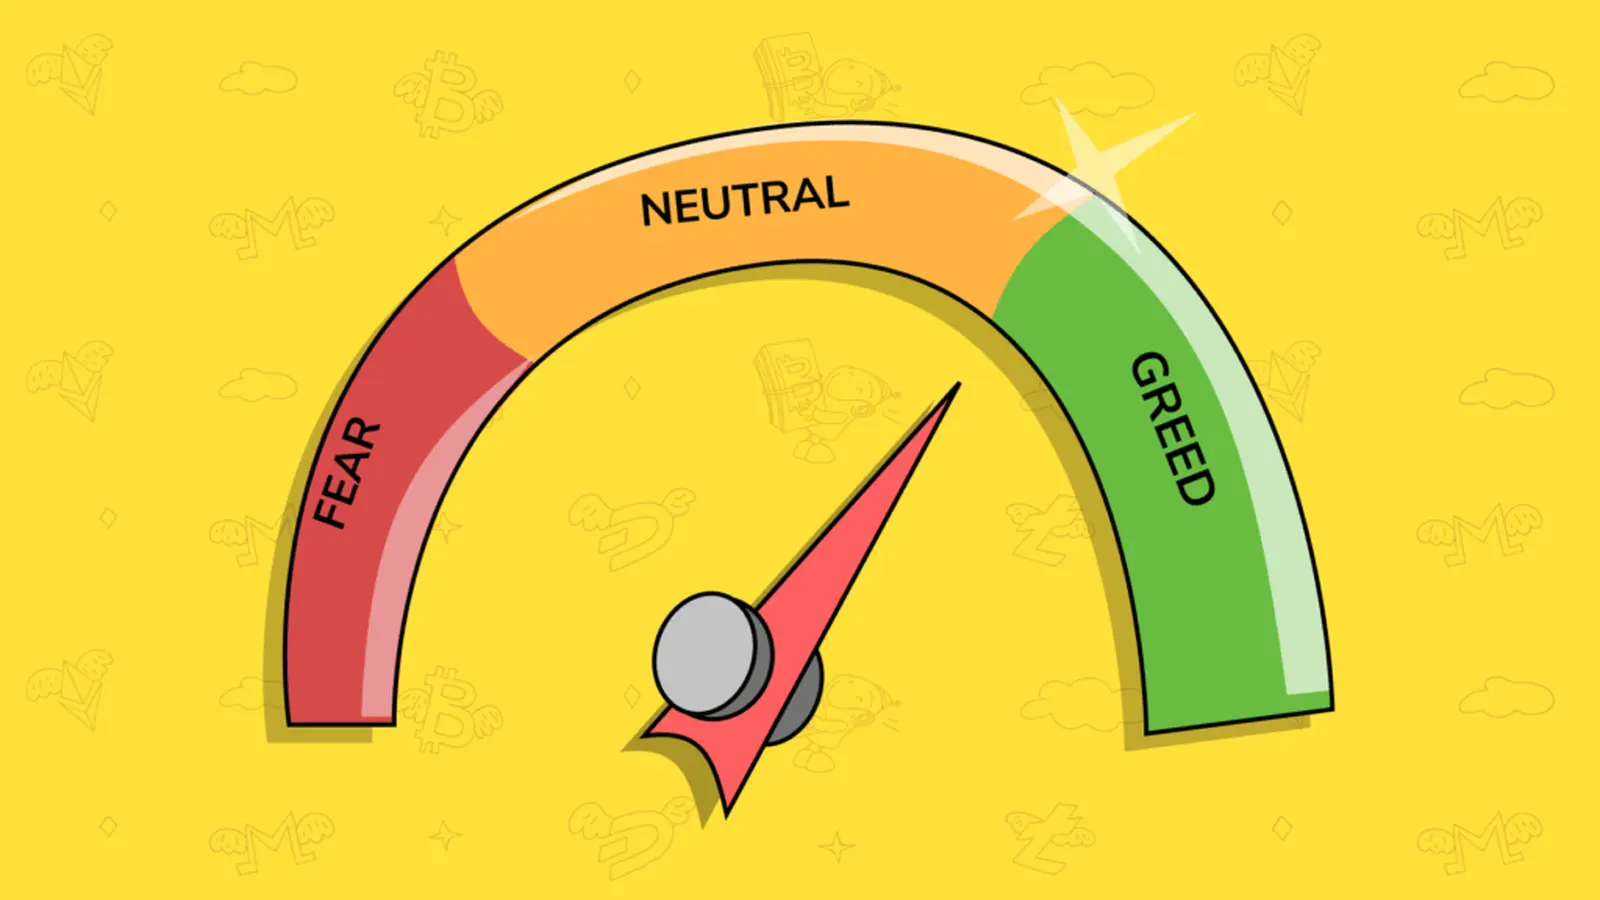
- The Fear & Greed Index briefly hit 9 — the lowest since July 2022 — before recovering to 14, signaling extreme fear.
- Short-term holders drove most selling, while long-term holders behaved closer to normal mid-cycle profit-taking.
- Spot Bitcoin ETFs recorded a third consecutive week of net outflows, weighing on market sentiment.
Price action and macro drivers
On Nov. 17, Bitcoin briefly touched roughly $93,000 as traders reacted to risk-off moves in global equities and renewed concern about monetary policy. At the time of writing, BTC was trading near $95,700, down about 0.9% for the day. Ethereum slipped to roughly $3,210, also down near 0.8%.
Short-term funding dynamics and macro expectations amplified the decline. Odds of a December Federal Reserve rate cut fell sharply from above 60% last week to near 43%, sapping appetite for risk assets including major cryptocurrencies.

On-chain evidence: short-term holders lead the sell-off
On-chain analytics firm CryptoQuant flagged short-term holders as the primary sellers since Bitcoin’s $126,000 peak. Spent Output Profit Ratio (SOPR) for these cohorts dipped below 1 multiple times, a clear sign they were realizing losses and adding downward momentum.
Age-band and realized cap signals
Age-band data shows coins younger than three months accounted for the largest share of on-chain selling volume, consistent with capitulation among recent entrants. Meanwhile, Bitcoin’s Realized Cap continued to rise despite price weakness, suggesting that new capital has still been entering the market even as volatility spiked.
Data on spot ETF buyers indicates an average cost basis near $86,680. With Bitcoin trading close to 9% above that level, there remains position-level diversity: some ETF holders sit in profit while short-term traders faced forced exits.
ETF flows and institutional behavior
U.S. spot Bitcoin ETFs experienced roughly $1.11 billion in net outflows between Nov. 10–14, marking a third consecutive week of withdrawals. BlackRock’s IBIT registered the largest single-week outflow at about $532.41 million, followed by nearly $290 million leaving the Grayscale Bitcoin Mini Trust.
Despite the outflows, the aggregate net asset value across all U.S. spot Bitcoin ETFs remained about $125.34 billion, which is approximately 6.67% of Bitcoin’s total market capitalization. Some industry observers note ETF flow patterns reflect broader investor reallocation rather than a structural impairment of Bitcoin treasuries.
Technical analysis: testing critical 2025 levels
Technically, Bitcoin has returned to the yearly opening band near $94,000–$95,000 after a roughly 27% pullback from the $128,000 highs. Traders are watching this zone closely; a hold here would support the thesis of range-bound consolidation, while a decisive breakdown could extend the drawdown.
Key indicators to watch
- 50-week exponential moving average: BTC recorded its first weekly close below this level since late 2023 — a signal some analysts say could precede deeper correction if sustained.
- Support band: $94,000–$95,000 is now a critical support area. A failed hold opens pathways toward the mid-range support near $75,000.
- Short liquidity: rapid retests and rebounds could trigger short-covering and a sharp rebound if sellers exhaust leveraged positions.
What market participants are saying
On-chain strategists and traders offered contrasting takes: some view the move as a healthy consolidation within a broader bull phase, while others warn the market may need more time to rebuild confidence after extreme fear readings. One well-known trader framed the market as a wide consolidation between $75,000 and $126,000, noting how prior range tops became later range bottoms.
Another analyst emphasized that a clean hold of the $94,000 area followed by a retest of $100,000 would likely force a large amount of short-side liquidity to cover, potentially fueling a rebound.
Market breadth and outlook
The total crypto market capitalization decreased to about $3.31 trillion, down roughly 0.9% on the day and down by approximately $1.1 trillion over the last 41 days. Elevated liquidation events and ETF outflows weighed on sentiment, but on-chain metrics such as rising Realized Cap and steady long-term holder behavior indicate that fresh capital continues to enter the ecosystem.
For traders and investors, the near-term roadmap is clear: monitor key support at the $94k–$95k band, watch ETF flows and liquidation metrics, and track macro cues from the Fed and equity markets. In a high-leverage environment, short-term volatility is likely to persist — but the long-term structural narratives for Bitcoin and major altcoins remain closely tied to adoption, ETF demand, and macro liquidity conditions.


Leave a Comment
Comments (2)
Whoa, Fear & Greed at 9? That actually gives me chills, market looks shaky but maybe bounce, fingers crossed
Is this even true? 565M liquidations in 24h sounds wild, or is ETF flow reporting off.. curious how they counted, any detal?