3 Minutes
XRP surges as ETF inflows and technicals align
XRP climbed more than 12% in a single session as renewed demand for XRP exchange-traded funds combined with improving technical indicators to spark a broad crypto market bounce. The token’s rally extends weekly gains to roughly 31% after a steep decline that wiped out nearly half of its value from mid-2025. With ETF flows, futures open interest and on‑chain momentum all trending higher, XRP looks positioned for a potential follow-through move of about 15% if current momentum persists.
Key drivers behind the move
ETF inflows: fresh institutional and retail capital
One of the clearest catalysts for the recent upside is a resurgence in XRP ETF inflows. Data shows that XRP-focused ETFs recorded $46.1 million in net inflows on Monday, Jan. 5 — the largest single-day inflow in nearly five weeks. Increased ETF subscriptions typically mean fund managers are buying the underlying token to meet redemptions, creating direct upward pressure on spot XRP price.
Futures open interest and leverage returning
Futures markets are also signaling renewed conviction. Open interest in XRP futures rose roughly 21% in 24 hours to $4.65 billion, indicating leveraged traders are re-entering the market. When both open interest and price climb together, it usually reflects new money entering longs rather than mere short-covering, lending credibility to the sustainability of the rally.
Bitcoin rebound and sentiment shift
Bitcoin’s brief move back above $94,000 helped lift broader market sentiment, nudging the Crypto Fear & Greed Index from extreme fear into neutral territory. Historically, large-cap altcoins like XRP tend to follow positive sentiment shifts in BTC, attracting both retail and institutional attention.
Technical outlook: falling wedge breakout confirmed
On the daily chart, XRP has completed a textbook breakout from a falling wedge pattern that developed since October 2025. Falling wedges are defined by two converging downward trendlines; a confirmed breakout above the upper trendline typically precedes meaningful short- to medium-term rallies.
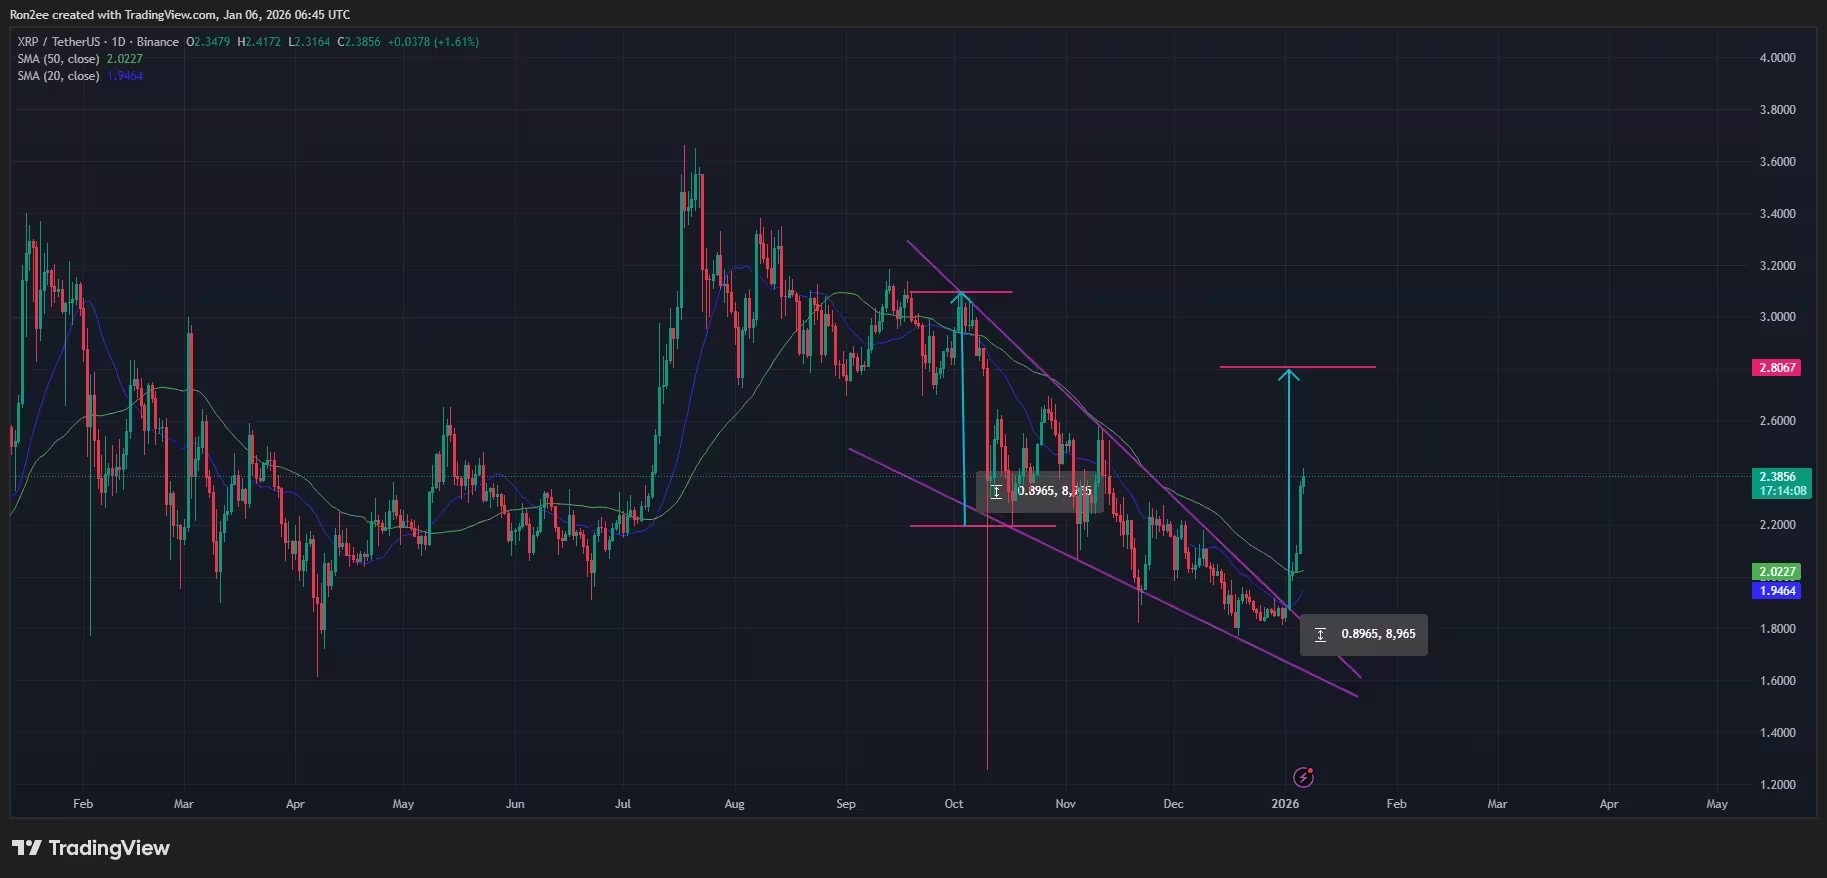
XRP price has confirmed a bullish reversal pattern on the daily chart. XRP price has confirmed a bullish reversal pattern on the daily chart — Jan. 6
Complementary indicators support a bullish bias: the 20-day simple moving average is nearing a bullish cross above the 50-day MA, and MACD lines are angled higher, reinforcing the positive momentum narrative.
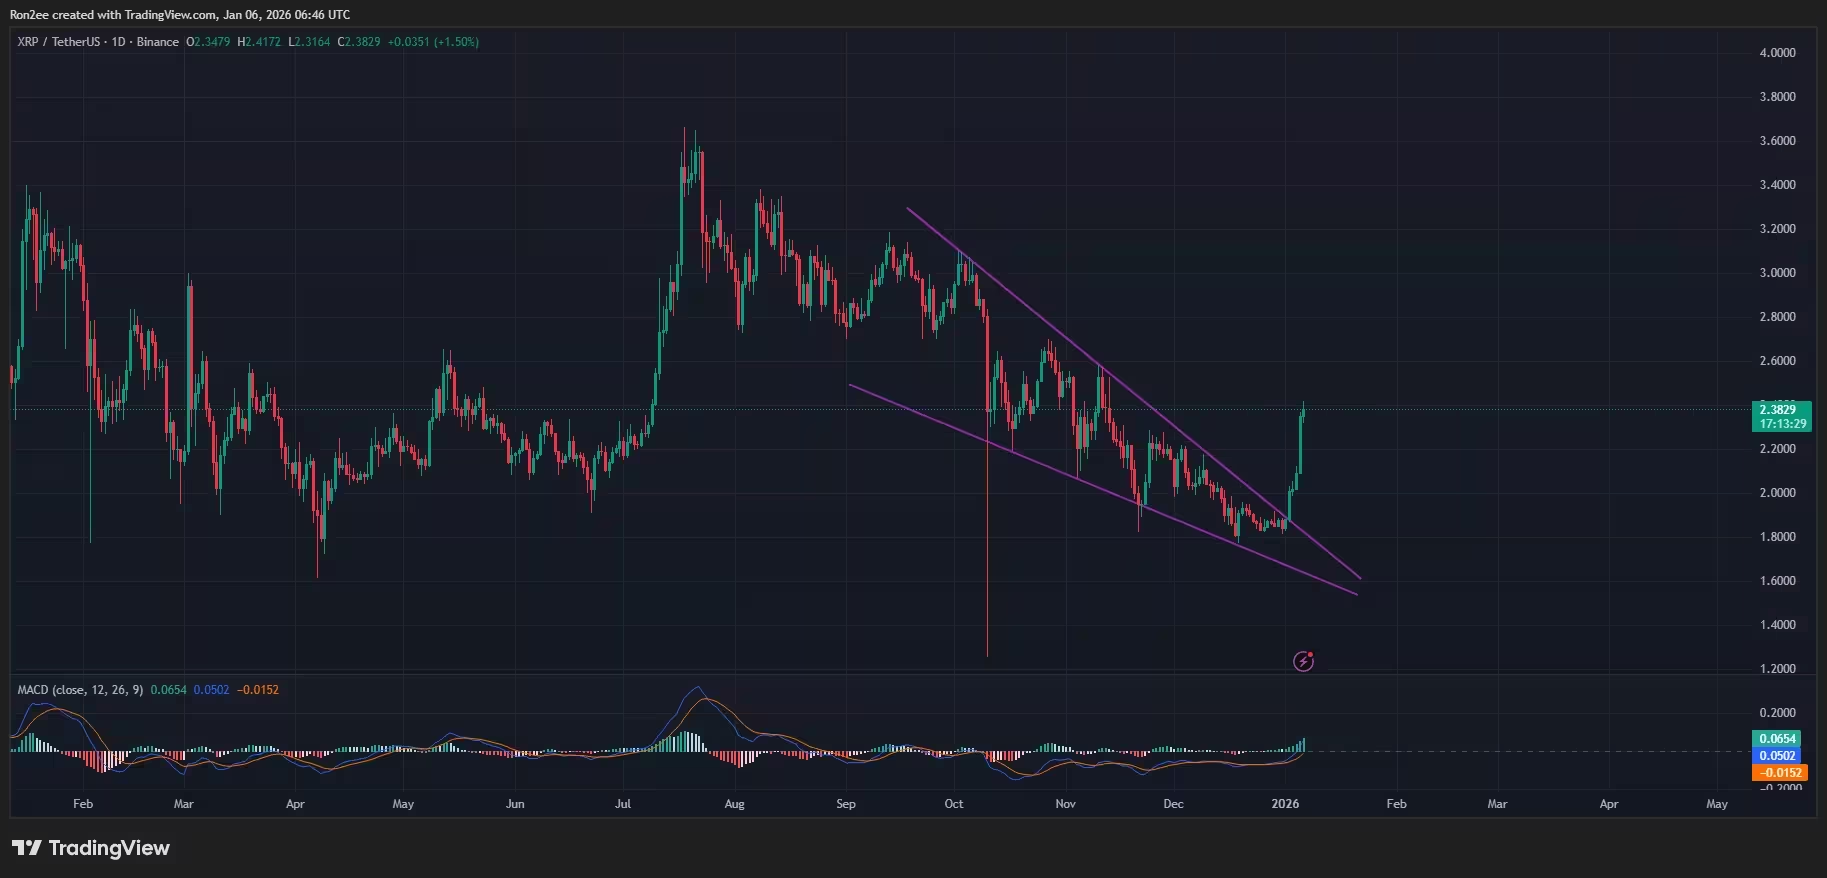
XRP price and MACD chart. XRP price and MACD chart — Jan. 6
Price target and risk management
Using the height of the wedge measured to the breakout point, a realistic near-term target sits around $2.80 — roughly 15% above the current trading level. Traders should remain mindful of volatility: while technicals and flows favor upside, rallies in leveraged markets can reverse quickly on shifts in macro risk appetite, regulatory headlines, or abrupt liquidity flows.
What traders and investors should watch next
- Continuing ETF inflows: sustained daily net purchases would support higher spot prices.
- Futures open interest and funding rates: rising OI with stable funding suggests healthy new long entries.
- Bitcoin price action and macro sentiment: BTC weakness could drag altcoins lower even if XRP-specific flows remain positive.
- Key technical levels: hold above the wedge breakout and the 20-day MA for bullish confirmation; failure below these could invite pullbacks.
In summary, a confluence of ETF demand, renewed leveraged interest, improved market sentiment and a confirmed falling wedge breakout gives XRP a constructive near-term outlook. If inflows and technical momentum continue, a ~15% extension toward $2.80 is a plausible next move, but traders should size positions with volatility and event risk in mind.
Comments
No comments yet.
Leave a Comment