3 Minutes
Cardano outlook: bullish signal despite weakening fundamentals
Cardano (ADA) has experienced a notable pullback from its October peak, with prices down roughly 60% from that high and about 25% lower than December’s local top. Market cap contracted from around $35.1 billion to near $12.9 billion at the time of reporting. Several on-chain metrics — including total value locked (TVL), stablecoin supply on-chain, and futures open interest — have weakened, pressuring sentiment even as technicals hint at a possible reversal.
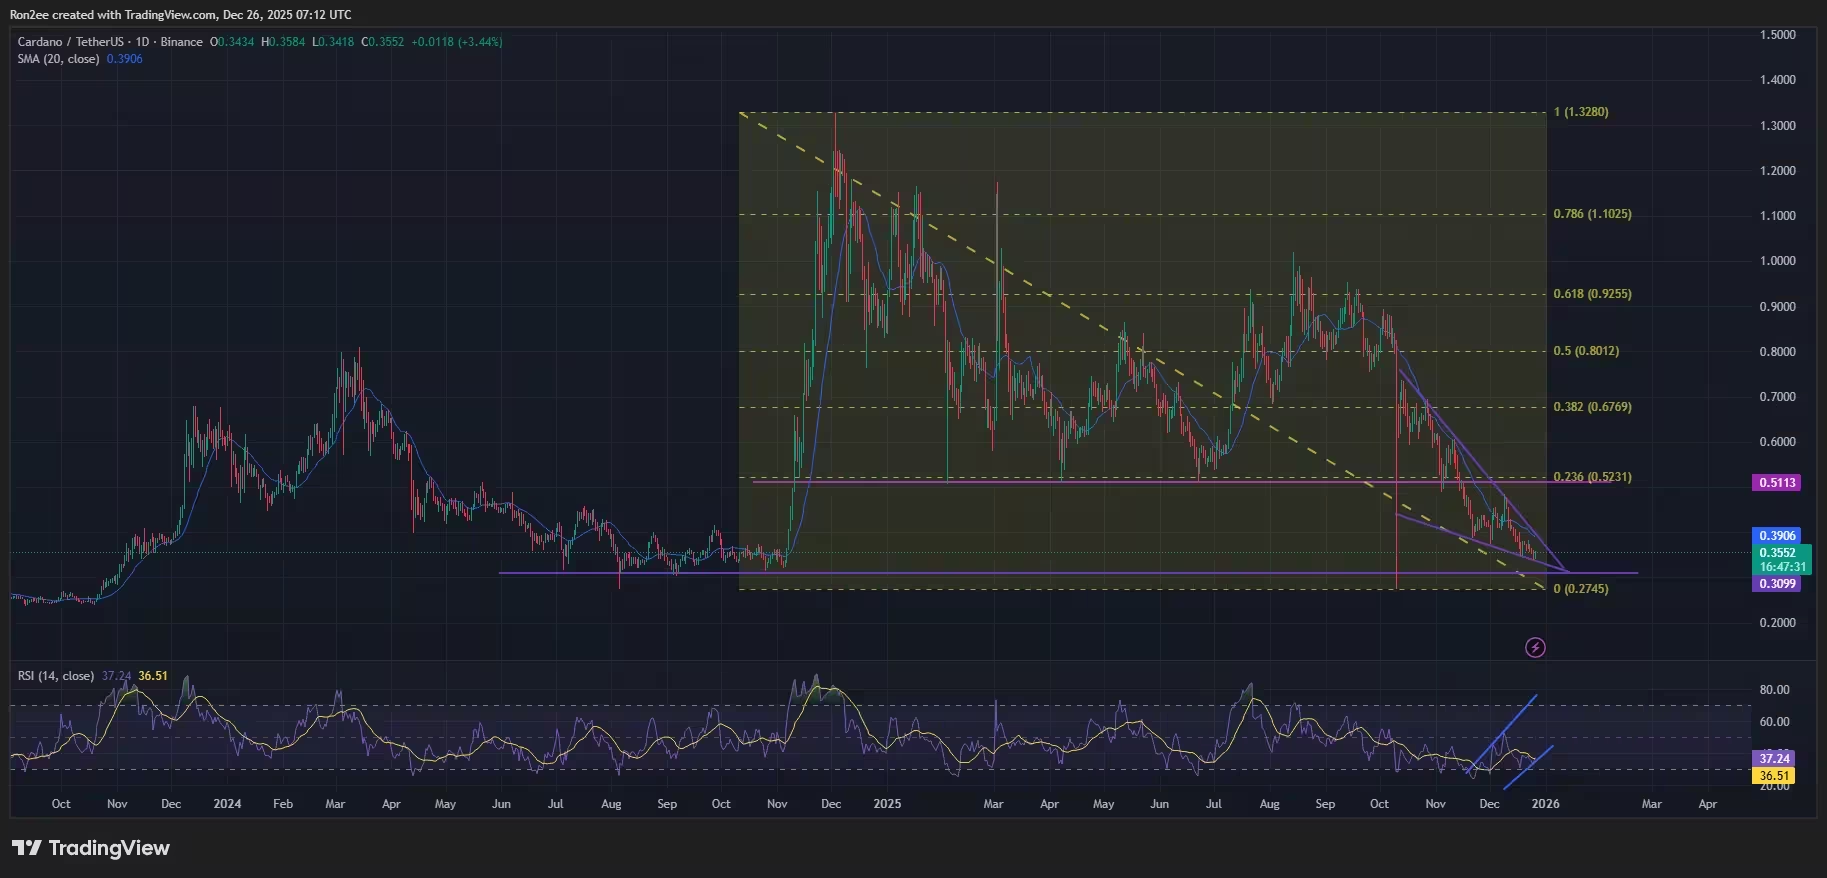
Cardano price has formed a falling wedge pattern on the daily chart — Dec. 26
On-chain weakness: TVL, stablecoins and derivatives
Data from DefiLlama shows TVL on Cardano-based DeFi protocols plunged from an August peak of $544 million to about $215.5 million, signaling lower user engagement and reduced liquidity in the ecosystem. The stablecoin market cap on Cardano likewise eased from a November high of $40.48 million to roughly $37.68 million, indicating reduced stablecoin issuance or migration off-chain.
Derivatives metrics confirm diminished speculative interest: CoinGlass reports ADA futures open interest fell from $1.72 billion in October to about $651 million at the time of writing. Lower futures open interest often accompanies decreased leverage and volatility, which can suppress rapid price moves in either direction.
These deteriorating fundamentals — falling TVL, shrinking stablecoin supply, and reduced futures activity — have contributed to a cautious investor stance and softer price action for ADA in recent months.
Technical picture: falling wedge and bullish divergence
Despite weaker on-chain fundamentals, ADA’s daily chart has developed a classic falling wedge pattern since early October. Falling wedges are formed by two converging, descending trendlines and are often considered bullish continuation or reversal structures when price breaks out above the upper trendline.
Momentum indicators add weight to the technical case: the relative strength index (RSI) has created a bullish divergence, where momentum improves even as price makes lower lows. Traders typically look for a confirmed breakout above the 20-day simple moving average (SMA) — around $0.39 at press time — as validation that the wedge has been breached to the upside.
Potential targets and risks
If ADA clears the 20-day SMA and the wedge’s upper boundary with sustained volume, a technical target near $0.51 is possible. That target is derived by adding the wedge’s height to the breakout price and represents roughly a 45% upside from current levels. Conversely, a failure to hold the lower wedge trendline could expose ADA to a drop toward $0.30, a support area that provided a floor through much of last year.
What traders should monitor
Key metrics to watch include TVL trends on DefiLlama, stablecoin supply on Cardano, futures open interest on CoinGlass, and on-chain transactional activity. From a technical perspective, confirmation of a breakout above the 20-day SMA and the wedge’s resistance, supported by rising volume and improving RSI, would strengthen the bullish case. Risk management remains essential: traders should prepare for either scenario and size positions accordingly.
In summary, Cardano’s fundamentals present headwinds, but the chart structure and momentum readings suggest a meaningful rebound is possible if buyers step in and confirm a breakout. Short-term momentum, on-chain liquidity indicators, and derivatives flow will determine whether ADA can realize the upside potential or slip back toward stronger support levels.


Leave a Comment
Comments
No comments yet. Be the first.