
3 Minutes
Bitcoin retests $92K as liquidations surge
Bitcoin (BTC) briefly slipped below the $92,000 support level on Monday, driven by a wave of forced liquidations and profit-taking after a recent rally. After peaking near a seven-week high around $94,400, BTC dropped to $91,540 before recovering some ground and trading around $92,670 at the time of writing. Traders and investors watched closely as nearly $441.5 million in positions were liquidated in the past 24 hours, accelerating intraday volatility.
What triggered the dip?
Short-term profit-taking appears to be the primary driver, with traders locking in gains after Bitcoin climbed roughly 12% from December lows near $84,500. Large-scale long liquidations accounted for most of the damage: CoinGlass data shows about $288.02 million of those liquidations were long positions, which typically intensifies selling pressure as exchanges automatically close leveraged bets.
Institutional flows and market sentiment
Institutional dynamics also added to the downside. Spot Bitcoin ETFs, which had seen strong inflows recently—including a notable bump from BlackRock’s IBIT—shifted back to net outflows, losing roughly $243 million over the past day according to SoSoValue. Despite these outflows and the liquidation wave, market measures suggest the pullback was more technical than panic-driven: the Crypto Fear & Greed Index stabilized at a neutral 49, implying a measured environment rather than extreme investor fear.
Technical outlook: double bottom and momentum signals
On the daily chart, BTC has been carving a double bottom pattern — a bullish reversal setup that can precede renewed rallies once confirmed. Bitcoin failed to sustain a break above the pattern’s neckline near $94,480, leading to the short-lived rejection that triggered the retest of $92K.
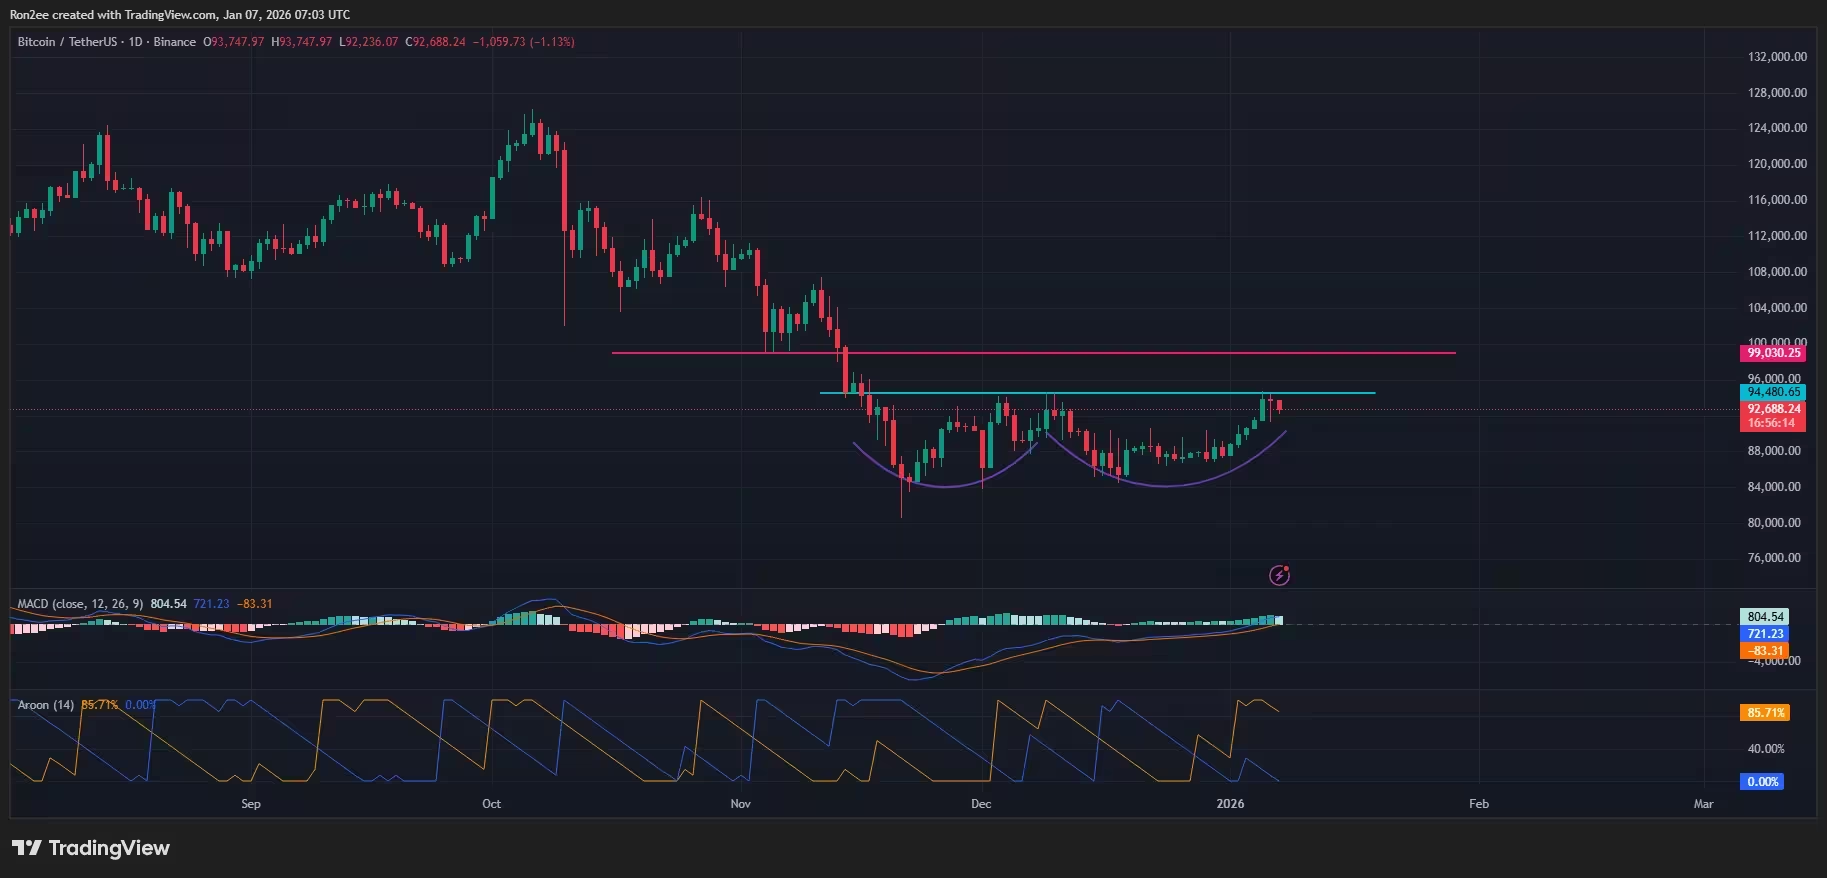
BTC price has formed a double bottom pattern on the daily chart — Jan. 7
Technical indicators still show underlying strength: the Aroon Up reads a strong 85.71%, signaling persistent bullish pressure, while the MACD lines have crossed above the zero line and are pointing upward, a classic sign of building momentum. These signals suggest buyers remain ready to defend key levels despite the recent shakeout.
Scenarios to watch
If bulls can reclaim and hold above the $94,400-$94,480 zone, a confirmed breakout would open the path to the next resistance band near $99,000. Such a move would likely attract fresh buying and reduce short-term blow-off risk.
Bearish risks
Conversely, a failure to overcome the $94.4K neckline could push Bitcoin back toward critical support between $85,000 and $88,000 — the area that anchored price during December’s corrective phase. Given the sizable liquidations seen this week, a renewed decline could be amplified by leveraged positions being forced out.
Bottom line
Monday’s dip under $92K felt like a liquidity reset rather than a structural breakdown. Liquidations and ETF outflows intensified the move, but price recovery above $92,000 plus bullish daily indicators keep the medium-term outlook intact. Traders should monitor ETF flows, liquidation heat maps, and momentum indicators (MACD, Aroon) for confirmation of either a sustained breakout toward $99K or a deeper retracement to the $85K–$88K support zone.
Source: crypto
Leave a Comment