
4 Minutes
ETH holds near $4,100 after forming bullish reversal
Ethereum (ETH) is testing a key support zone near $4,100 after a short pullback from Monday’s weekly high. The 4-hour chart shows a classic double-bottom reversal pattern, with both lows forming close to $3,713 and the neckline sitting around the $4,100 level. Traders and analysts watching price action, technical indicators, and liquidation maps are weighing whether this setup can spark a sustained rally or whether downside risks will prevail.
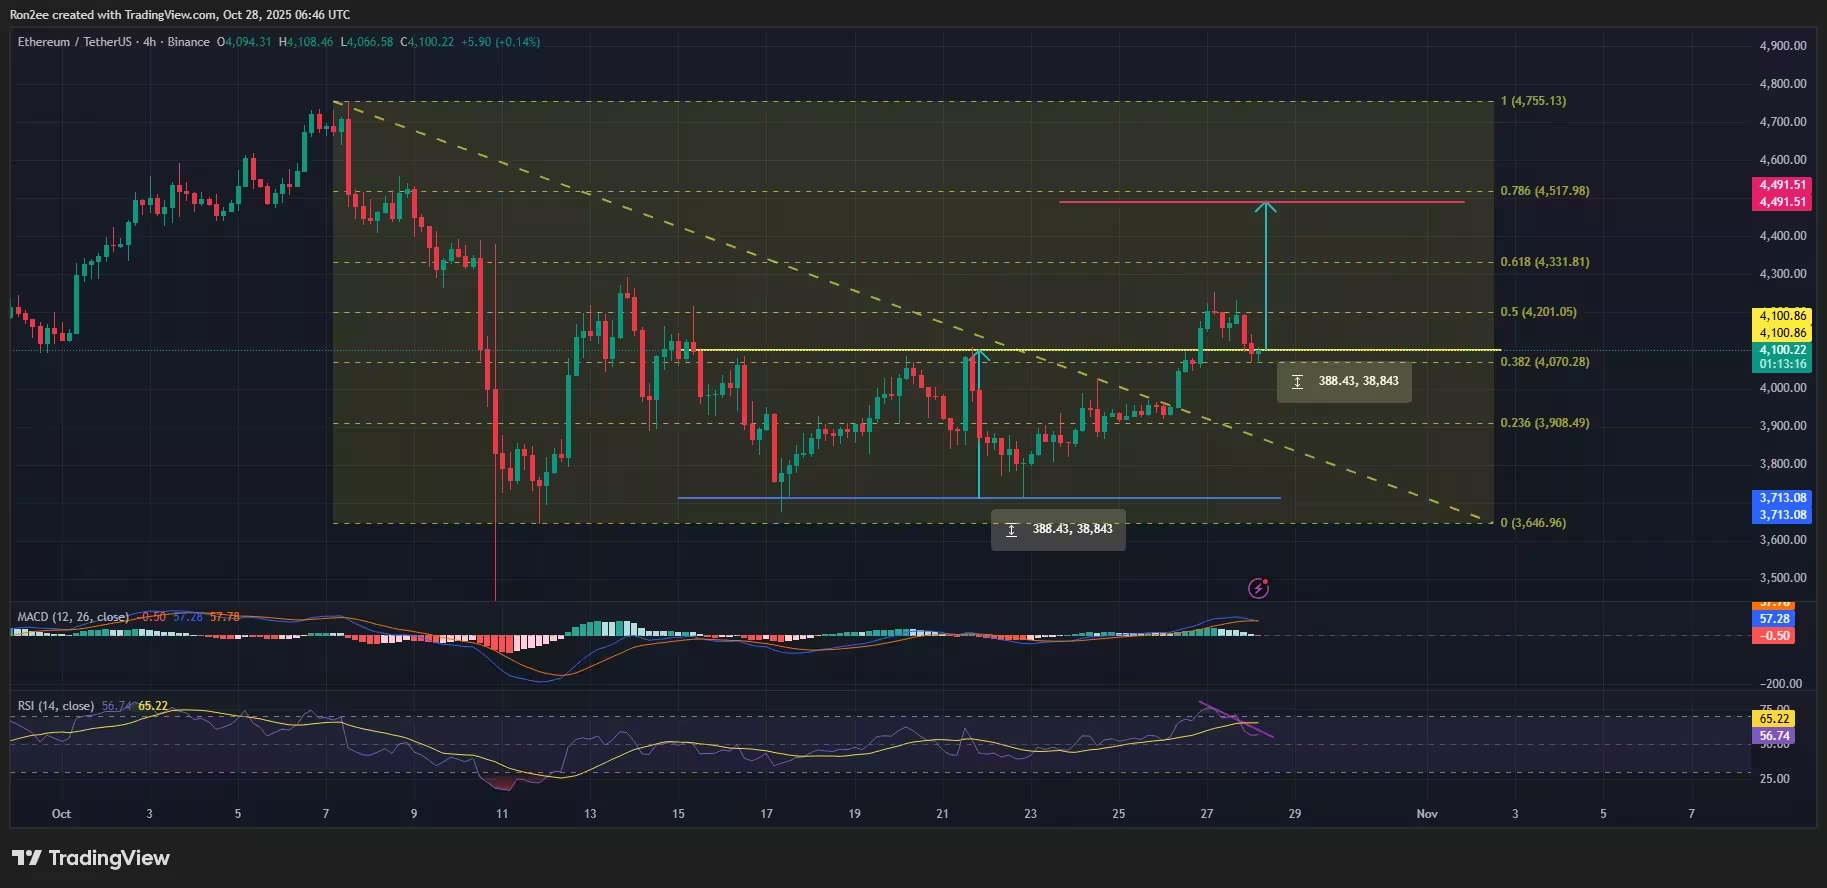
ETH price has formed a bullish reversal pattern on the 4-hour chart — Oct. 28
Why the double-bottom matters
A double-bottom is a widely followed bullish pattern in technical analysis: two distinct troughs at similar price levels followed by a breakout above the neckline. For Ethereum, a confirmed breakout above the $4,100 neckline could project a target near $4,491 — roughly a 10% move from current levels — by measuring the pattern depth and adding it to the breakout point. That scenario would align with broader bullish momentum for altcoins and signal a potential continuation of the recent uptrend.
Indicators show mixed momentum
Despite the constructive chart pattern, momentum indicators are sending cautionary signals. The MACD appears to be approaching a bearish crossover with the signal line, which would indicate waning upside momentum in the short term. At the same time, the RSI has formed a bearish divergence, suggesting that rallies may struggle without fresh buying pressure. These mixed technicals mean a breakout would be more credible if it occurs with strong volume and confirmation from derivatives metrics.
Liquidation heatmap and short-squeeze potential
According to CoinGlass liquidation data, there is a concentration of short liquidations between $4,100 and $4,200 — overlapping the neckline of the double-bottom and the upper boundary of a previously identified falling wedge. A clean breakout above this band could force a short squeeze, triggering cascading long liquidations and accelerating an ETH rally toward the $4,400–$4,500 zone.
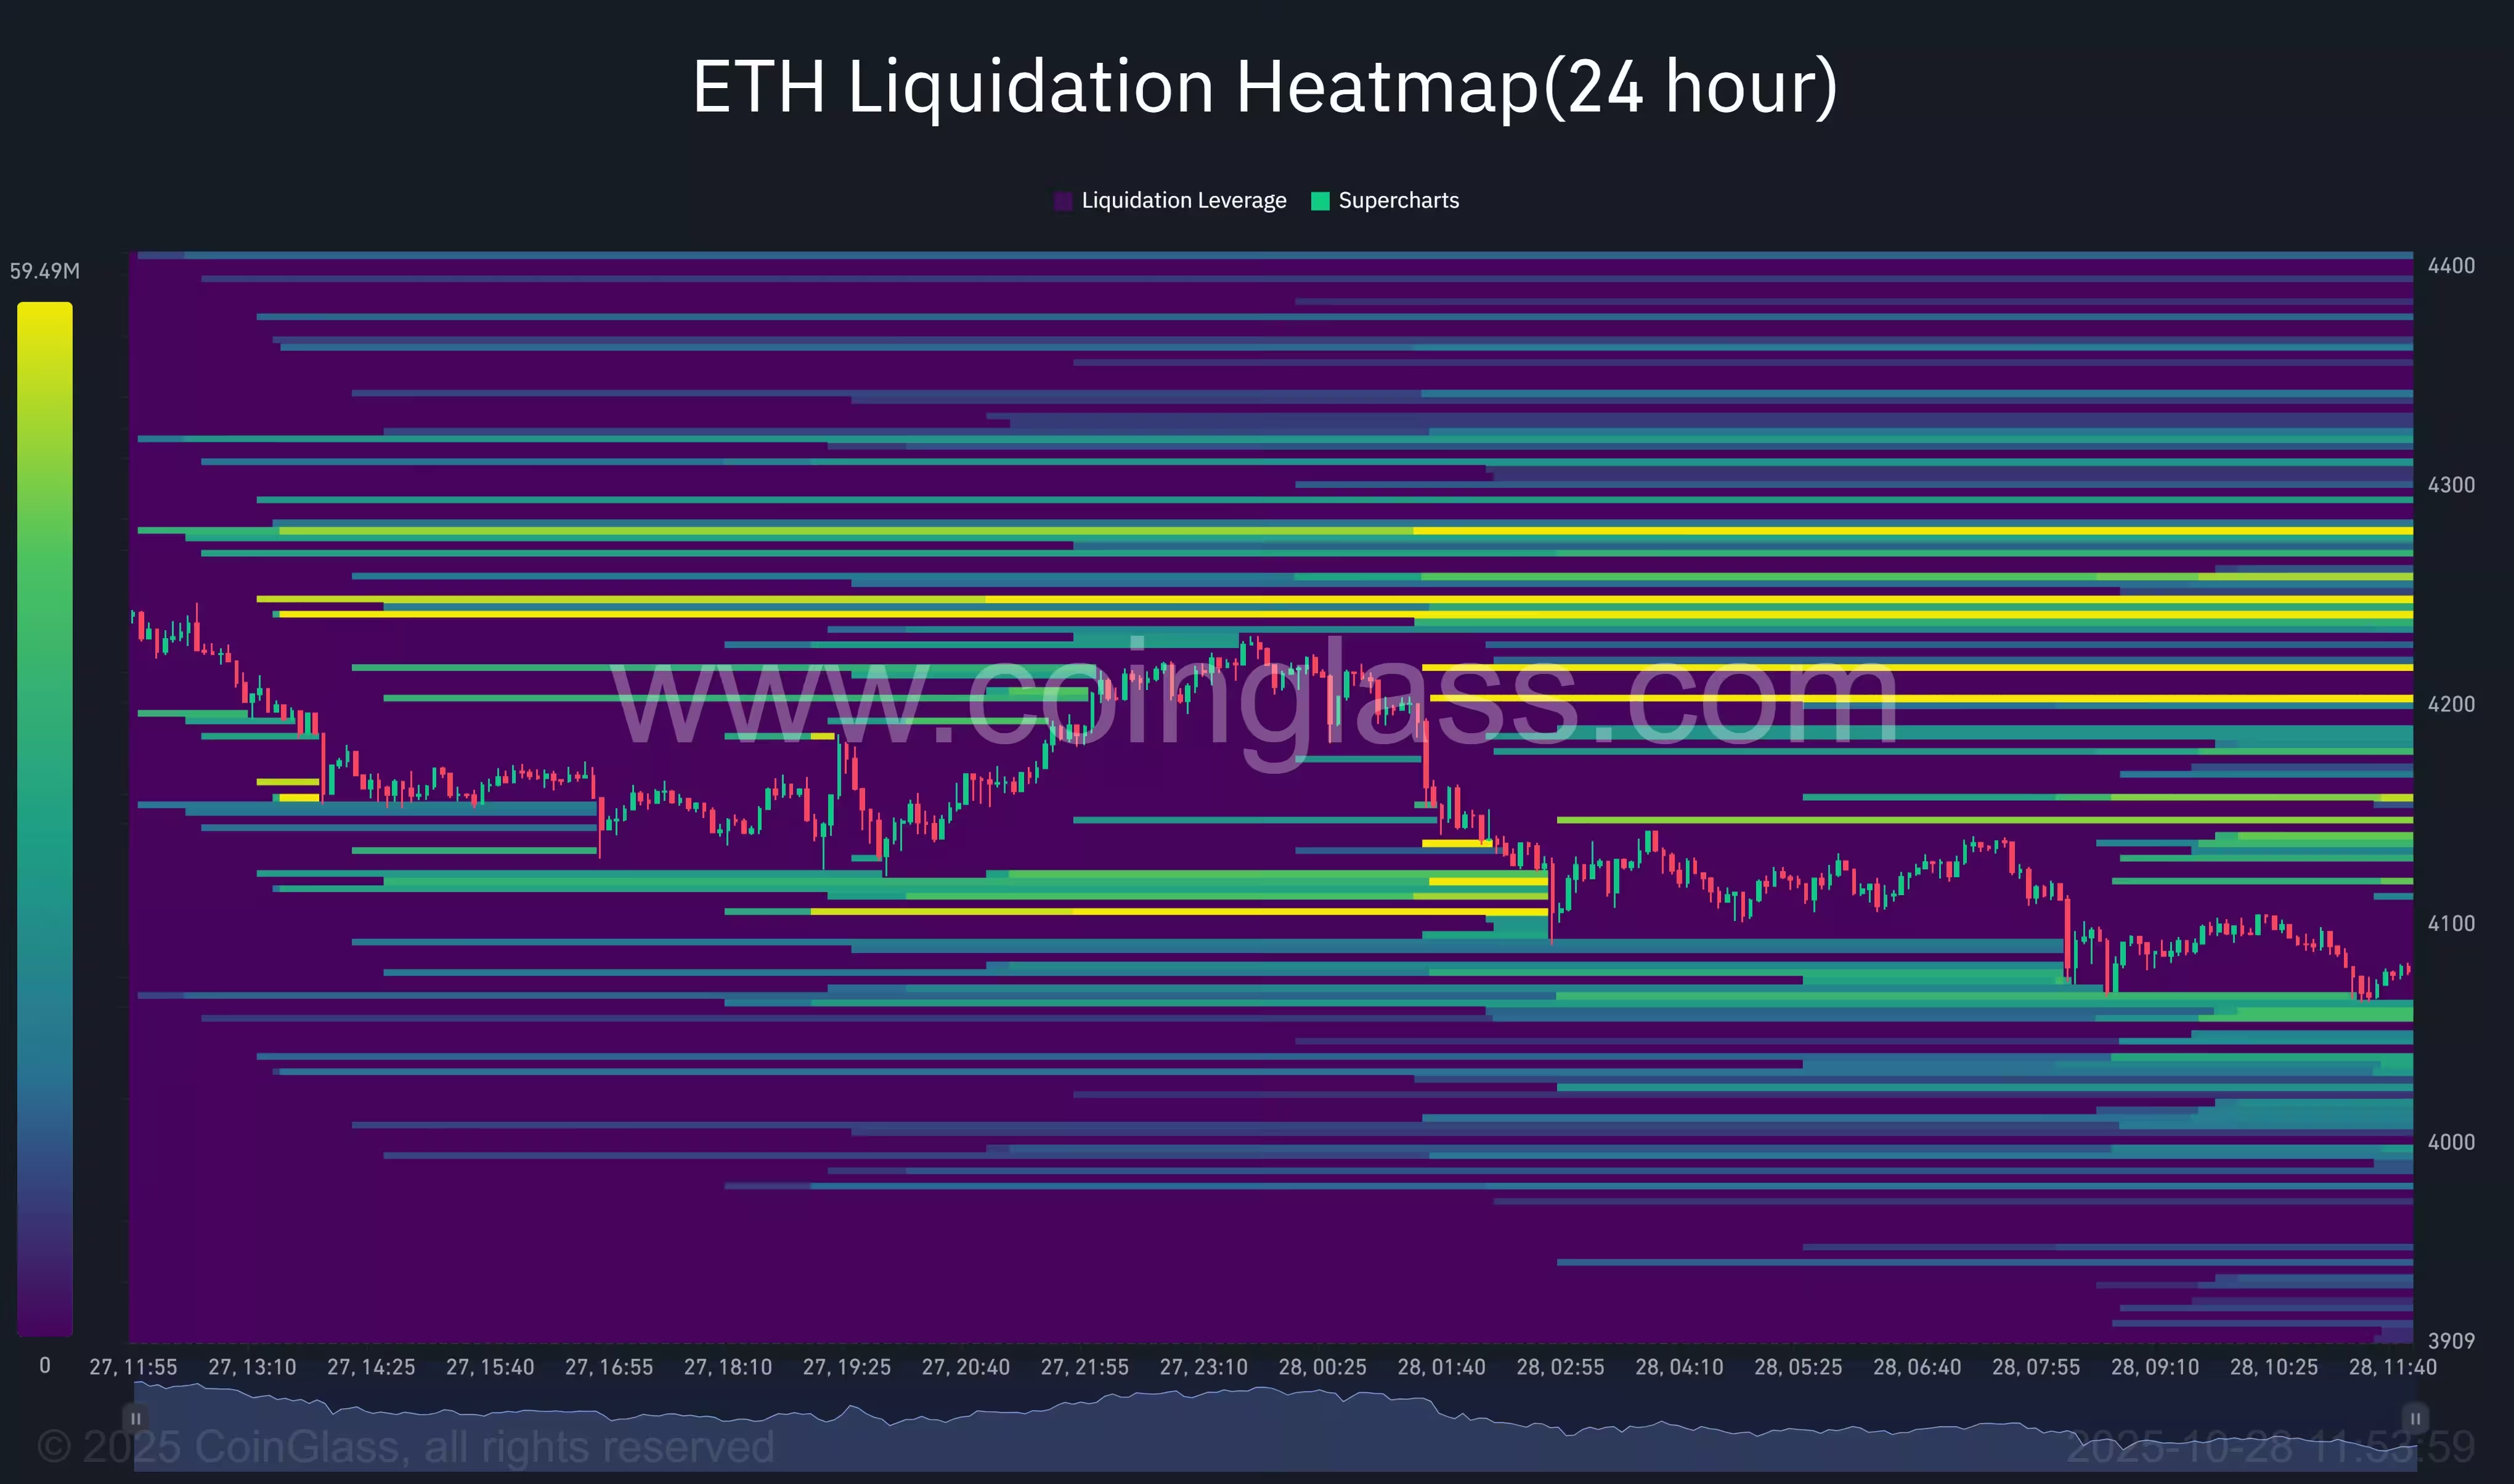
Conversely, the heatmap highlights significant liquidation interest between $4,000 and $3,900, a demand area that could absorb sellers and attract buyers. If bulls defend this zone, ETH could stabilize and attempt another breakout. However, a break below $3,900 would expose thinner liquidity and heighten volatility, opening the door to deeper declines toward $3,700–$3,650.
What traders should watch next
Key levels to monitor: immediate resistance remains near $4,100–$4,200 (neckline and liquidation cluster), while support zones are $4,000 and $3,900, with deeper support around $3,713 where the double-bottom lows formed. Watch for a confirmed close above the neckline on the 4-hour or daily chart with accompanying volume to validate a bullish breakout. On-chain and derivatives signals — including futures open interest and liquidation clusters — will clarify whether bulls have enough liquidity to fuel a sustained move.
Risk management is essential: traders should consider tightening stops on leveraged positions around the $3,900 support and be mindful of potential false breakouts. For longer-term investors focused on Ethereum’s fundamentals, the technical setup is interesting but requires confirmation before adding sizable exposure.
This technical snapshot combines chart pattern analysis with momentum indicators and liquidation mapping to provide a balanced view of ETH’s near-term outlook. As always in crypto markets, rapid price swings and changing sentiment can alter the scenario quickly, so traders should use position sizing and stop-loss strategies that match their risk tolerance.
Source: crypto
Leave a Comment