
2 Minutes
Price action and market context
Solana (SOL) slipped below the key $100 mark in the last 24 hours, falling to $97 as bearish momentum accelerated. SOL has lost more than 20% over the past week and roughly 31% in the last month, pulling back about 66% from its January 2025 peak near $293. Despite the sell-off, on-chain activity remains lively and trading flows show mixed signals for short-term outlook.
Volumes, ETFs and institutional interest
Spot trading volume for Solana rose 32% over 24 hours to $6.55 billion, while derivatives volume climbed about 40%, indicating active positioning across venues. Institutional interest appears intact: US spot Solana ETFs attracted $104 million in January, underscoring that some investors are using this correction to accumulate exposure.
Network fundamentals
Network metrics and developer activity continue to support Solana’s narrative as a high-throughput smart contract platform. Strong network usage can help underpin long-term value even as price action tests critical technical levels.
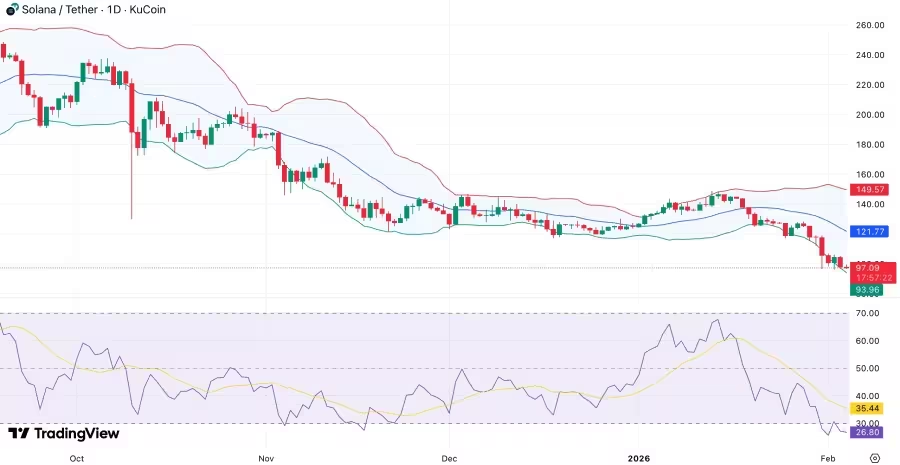
Technical outlook: support and resistance
The technical structure remains bearish: SOL is printing lower highs and lower lows, confirming seller dominance. Price has dropped beneath the daily moving average around $121, and recent bounce attempts have been short-lived. The psychological $100 support is now pivotal — a clear break below this zone could push SOL toward $95–$93 and potentially down to $85–$90.
Key levels to watch
Immediate resistance lies in the $120–$122 range, with the 21/50/200-day moving averages and volume profile offering further context. Traders and investors should monitor spot and derivatives volume, ETF flows, and on-chain activity for signs of stabilization or renewed downside.
Stay tuned for updates as the market reacts; risk management remains essential in this volatile environment for SOL and the broader crypto market.
Leave a Comment