
6 Minutes
Bitcoin's rebound masks mounting downside risks
Bitcoin (BTC) climbed back above $76,000 this week after briefly touching a 15-month low near $72,860. The short-term recovery has provided relief to traders, but a broad set of technical patterns and on-chain metrics point toward additional weakness ahead. Miners under pressure, rising exchange inflows and established bearish chart formations suggest the recent bounce could be temporary unless buyers absorb excess supply.
Technical charts target substantially lower levels
On multiple time frames, Bitcoin has confirmed bearish structures that historically imply deeper corrections. The weekly BTC/USD chart shows a completed head-and-shoulders pattern with a neckline breach around $82,000. The classical measured target from that breakdown reaches toward roughly $52,650 — a move that would amplify losses to around 31% from current prices and extend the drawdown from the all-time high to nearly 58%.
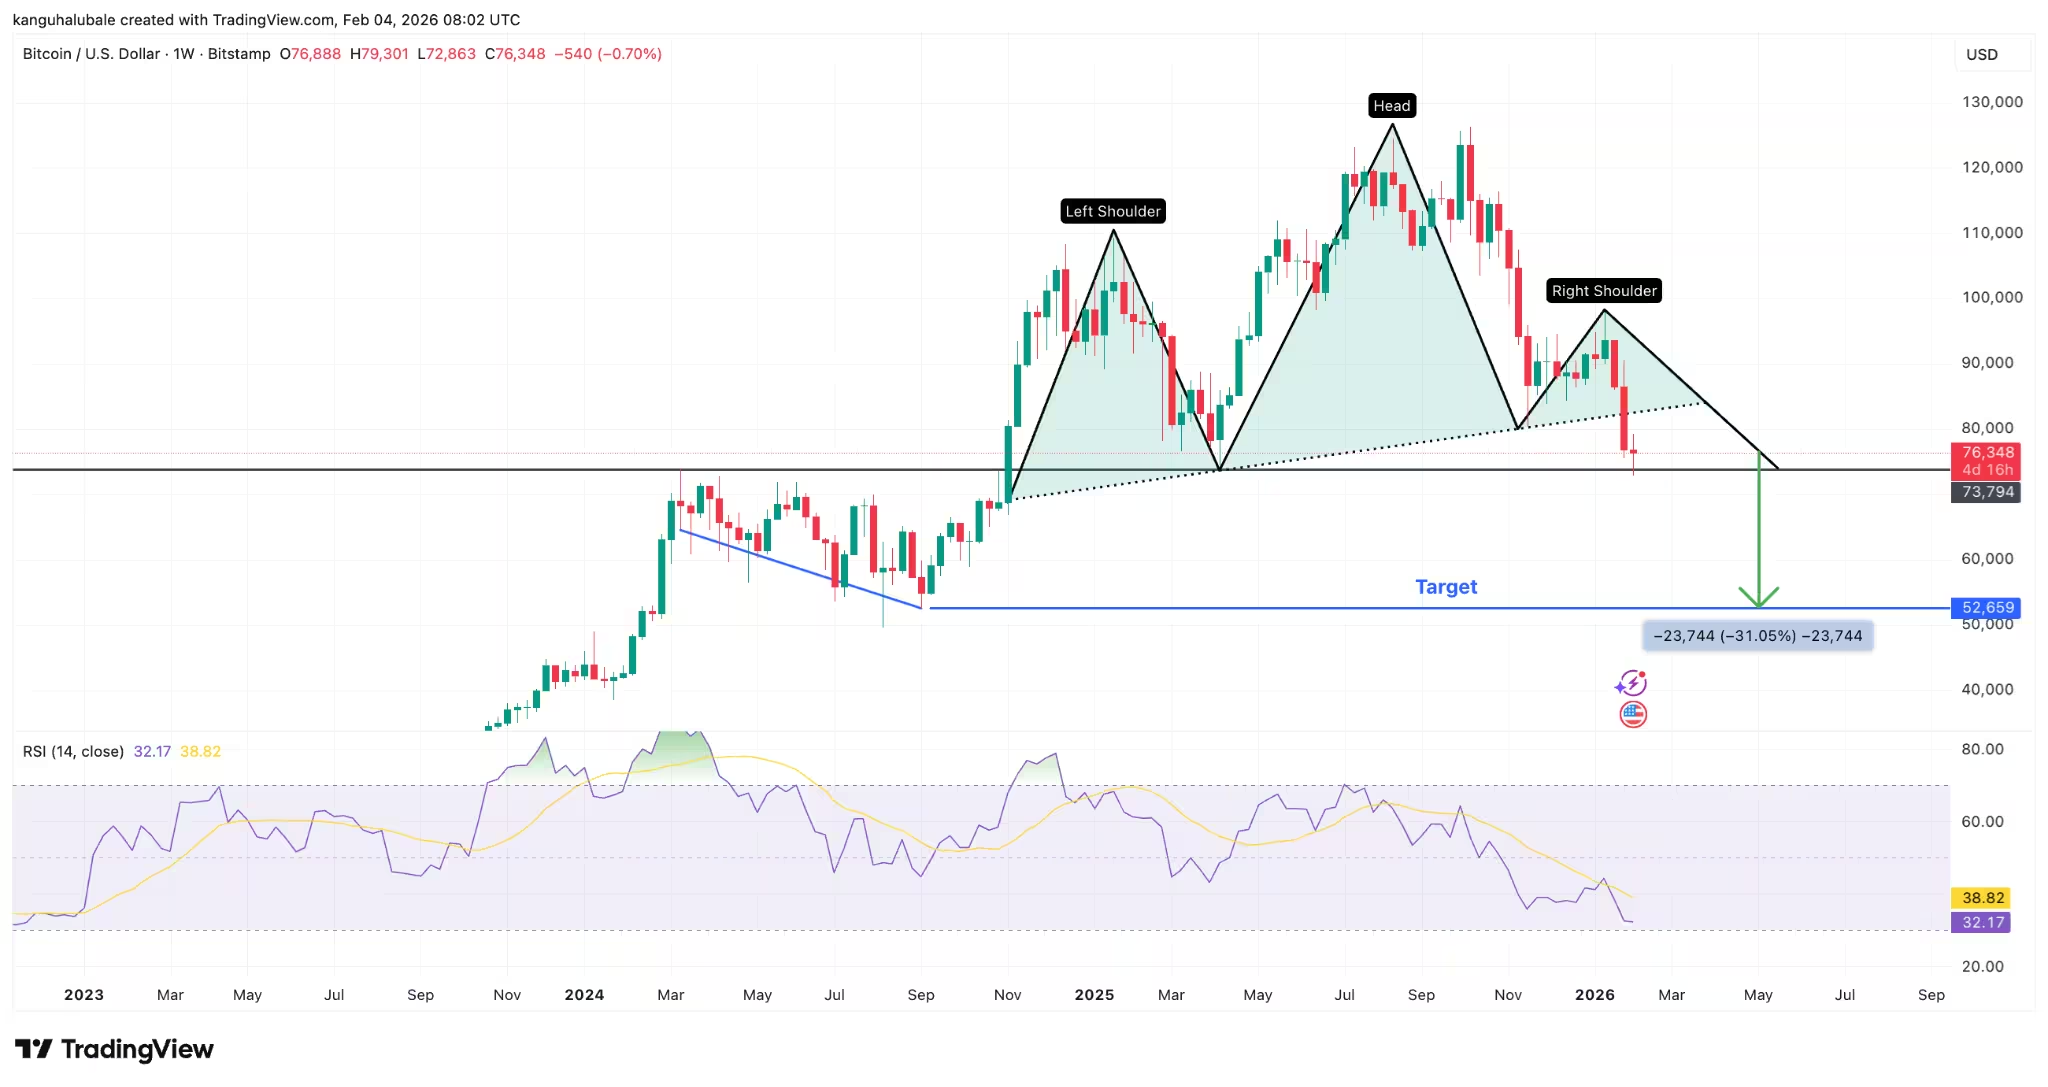
BTC/USD weekly chart
Shorter time frames bolster the downtrend case. After key supports gave way, daily price action formed and confirmed a bear flag. Once $78,000 failed to hold, technical traders identified the next liquidity magnet in the mid-$60,000s, with some models pointing to $65,500 as a focal point for order flow. A handful of analysts have even warned of steeper scenarios, highlighting how macroeconomic headwinds and dwindling on-chain support could pressure BTC as low as $40,000 in extreme cases.
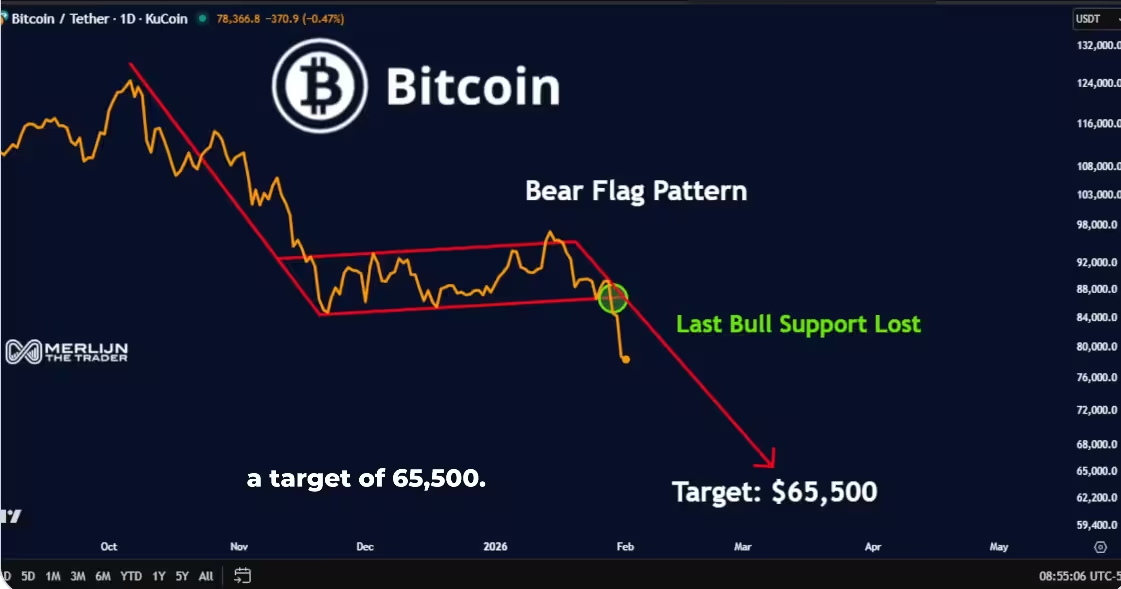
BTC/USD daily chart
These chart signals are important for traders and risk managers: they not only identify probable targets but also help define stop-placement, position-sizing and scenario planning for both spot and derivatives exposures in Bitcoin markets.
On-chain indicators show prolonged bearish conditions
Beyond price charts, the Puell Multiple — an on-chain metric that compares daily miner revenue against its annual average — remains in a discount zone consistent with accumulation and capitulation phases. The indicator has been depressed for months, which historically corresponds with prolonged periods of downward pressure or consolidation.
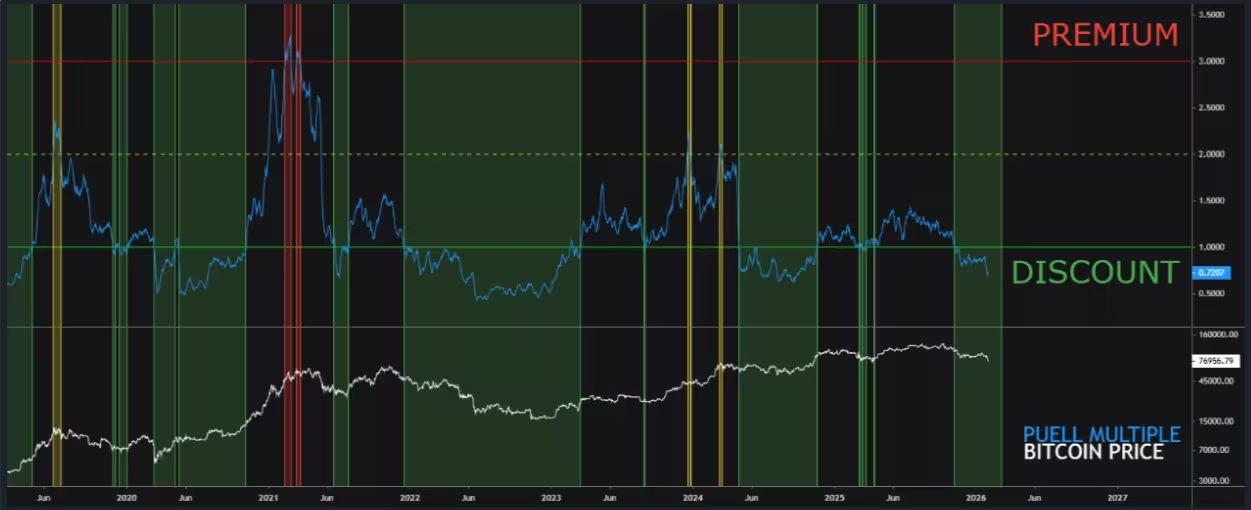
Bitcoin Puell Multiple and price comparison
According to CryptoQuant analysis, the Puell Multiple typically lingers in the discount zone for roughly 200 days. With the metric already extended for several months, the data implies the market may still be within a multi-month corrective phase. Lower miner revenues during such periods often force operational decisions among smaller or higher-cost mining operations, increasing the likelihood of miner shutdowns or reserve sales to cover expenses.
Miner reserves and hash rate trends
Miner balances on-chain have fallen steadily over recent years and now sit near 1.8 million BTC. Declining reserves reduce the buffer miners have against price shocks and can accelerate sell pressure if prices deteriorate further. At the same time, the network hash rate has dropped roughly 12% from its November highs — the largest decline since 2021 — signaling potential miner capitulation or reduced operational activity as revenue falls.
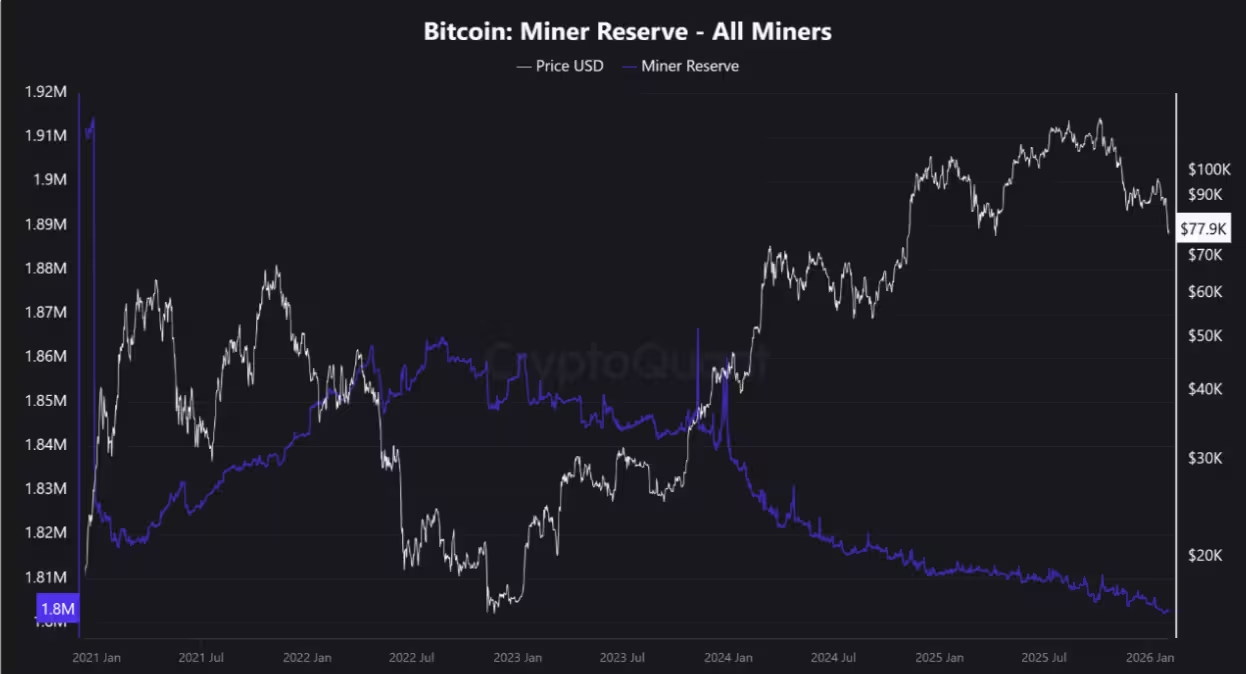
Bitcoin miner reserve
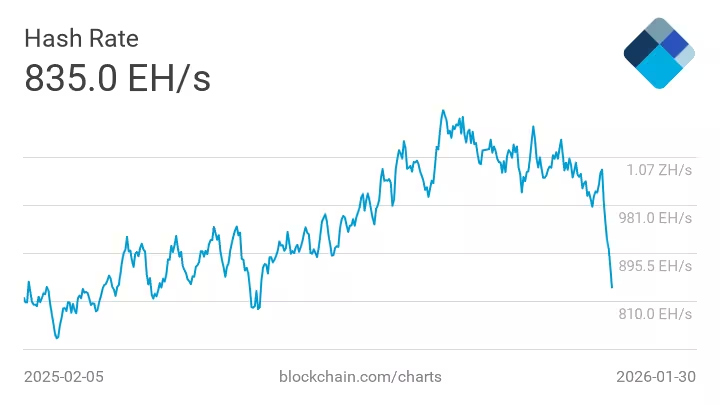
Bitcoin mining hashrate
These shifts in miner behavior are critical because sustained selling from a concentrated sector of long-term holders can influence spot liquidity and derivative funding rates, thereby shaping short-term volatility.
Exchange inflows intensify sell-side pressure
A striking development on the exchange side is a recent spike in BTC flows to Binance. Daily inflows reached 15,709 BTC on Tuesday, the largest one-day total since November 21, 2025. Over a two-day span, on-chain trackers reported between 56,000 and 59,000 BTC transferred to Binance, a sizable accumulation of sell-side inventory on a major spot marketplace.
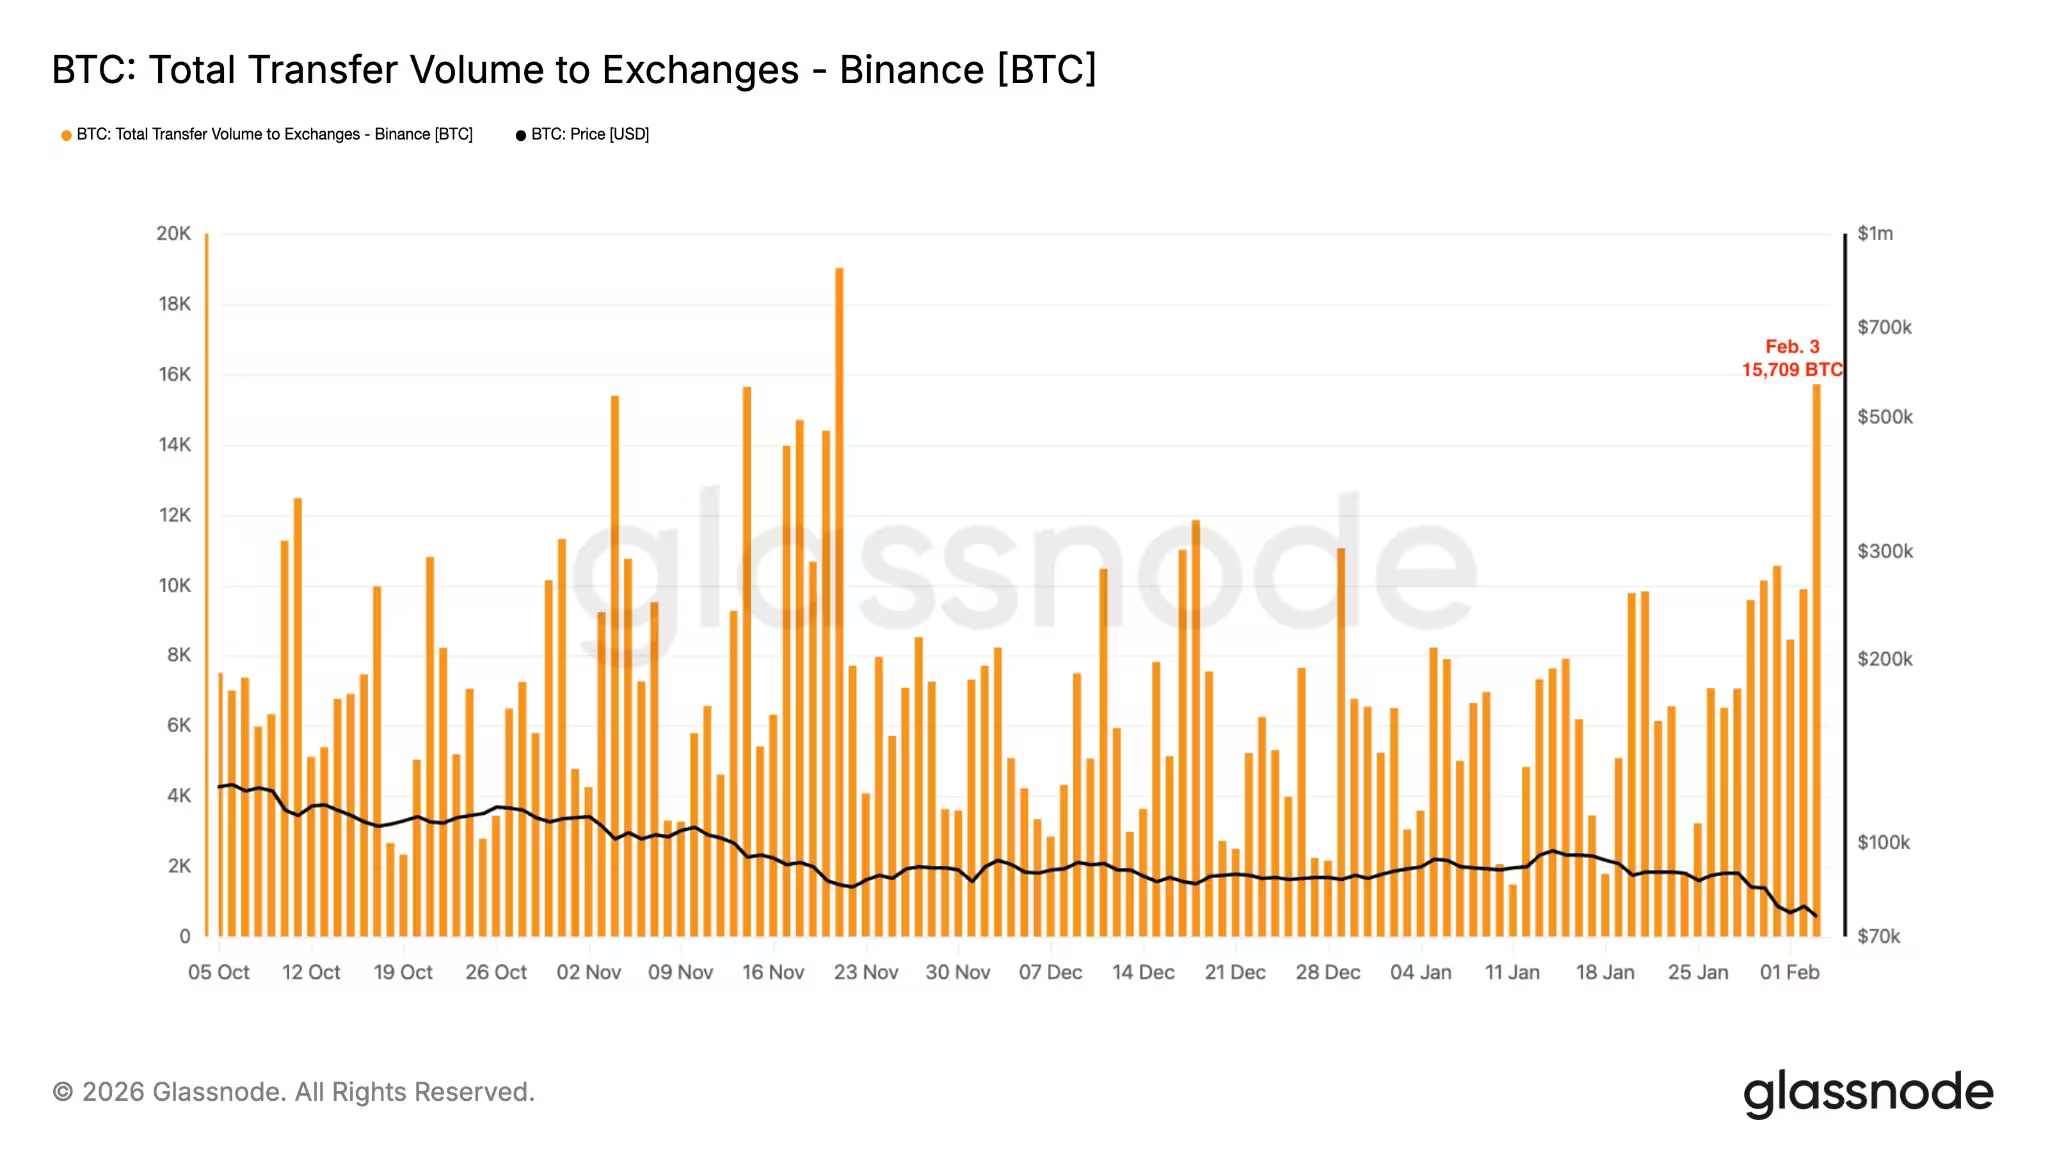
Bitcoin exchange inflow (total) to Binance
Historically, sharp surges in exchange inflows have preceded accelerated price declines as incubating sell orders hit the market. Analysts monitoring on-chain movement interpret the current buildup as an indicator that some holders are de-risking or preparing to liquidate positions, increasing the probability of continued downward pressure until that supply is absorbed.
What traders and investors should monitor next
Key levels: Watch the $78,000 area as near-term resistance and $65,000–$60,000 zones as critical support clusters. A sustained break below the mid-$60,000 level would validate bear-flag and head-and-shoulders objectives for many technical traders.
On-chain signals: Track the Puell Multiple and miner reserves for signs of capitulation easing. If the Puell Multiple begins to recover from the discount zone and miner balances stabilize, that would be a constructive sign that selling pressure is diminishing.
Exchange inventory: Monitor BTC inflows and balances on major exchanges like Binance. Falling exchange holdings typically coincide with tightening supply and can support a durable recovery; conversely, rising inventories often precede further declines.
Outlook
Bitcoin’s move back to roughly $76K offers a reprieve, but the broader risk picture remains tilted to the downside. The convergence of bearish technicals, prolonged discount readings in the Puell Multiple, shrinking miner reserves and surging exchange inflows raises the odds of a deeper correction over the coming weeks or months. Traders should treat current bounces with caution, manage leverage carefully and follow on-chain signals alongside traditional technical analysis to build informed scenarios for both short-term trades and longer-term allocations.
Source: cointelegraph
Comments
Marius
Pretty balanced take but $65k target would sting. Watching Puell and miner reserves closely, hmm
coinpilot
Miners selling, Binance inflows huge, but is this even true or just noise? feels like panic sell to me, maybe i'm late to the party
Leave a Comment