
5 Minutes
Bitcoin may be undervalued after recent dip
Bitcoin (BTC) appears to be forming the technical and on-chain foundations for a near-term recovery, with several key indicators pointing to a buy-the-dip opportunity. After dipping to roughly $80,500, BTC has shown an 8.6% bounce. On-chain metrics such as the Puell Multiple and the MVRV Z-Score are signaling that miners and the broader market may be operating under atypical stress — historically fertile ground for trend reversals and new rallies.
Puell Multiple returns to discount territory
Data from CryptoQuant shows the Puell Multiple, which compares miners’ daily BTC issuance revenue to its annual average, has dropped into a discount zone. At 0.86, the metric is below the 1.0 threshold that often flags miner revenue weakness and capitulation risk. Crypto analysts note that readings beneath this range have historically coincided with market bottoms and the formation of new uptrends.
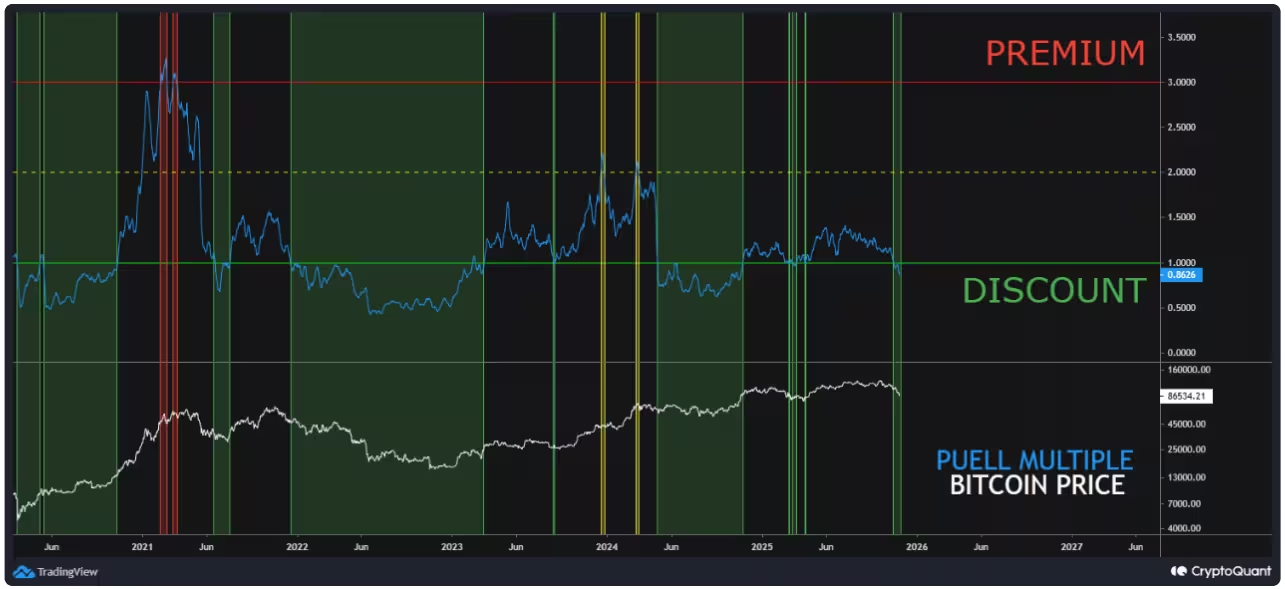
Bitcoin Puell Multiple and price comparison
When miners receive less revenue relative to their historical average, selling pressure can intensify — but it also means the market may be absorbing supply at lower prices. CryptoQuant analyst Gaah observed that the last time the Puell Multiple dipped so low was in April 2025, just before BTC rallied roughly 50% toward prior all-time highs. For traders and investors focused on on-chain signals, a low Puell Multiple often serves as a contrarian indicator: periods of miner stress can mark attractive accumulation zones for long-term capital.
Why the Puell Multiple matters for BTC price action
The Puell Multiple is valuable because it ties miner economics directly to market supply dynamics. When miners’ revenues fall, they can be forced to liquidate reserves or reduce sell-side pressure, removing a key source of supply. That dynamic, combined with functionally unchanged long-term demand, has historically contributed to price reversals.
MVRV Z-Score points toward a local bottom
Another critical on-chain metric, the MVRV Z-Score from Capriole Investments, has also declined noticeably. This score compares market value to realized value while adjusting for volatility. The metric fell to a two-year low on Nov. 22 and currently sits around 1.13, approaching a historically meaningful green line that often signals deep undervaluation.
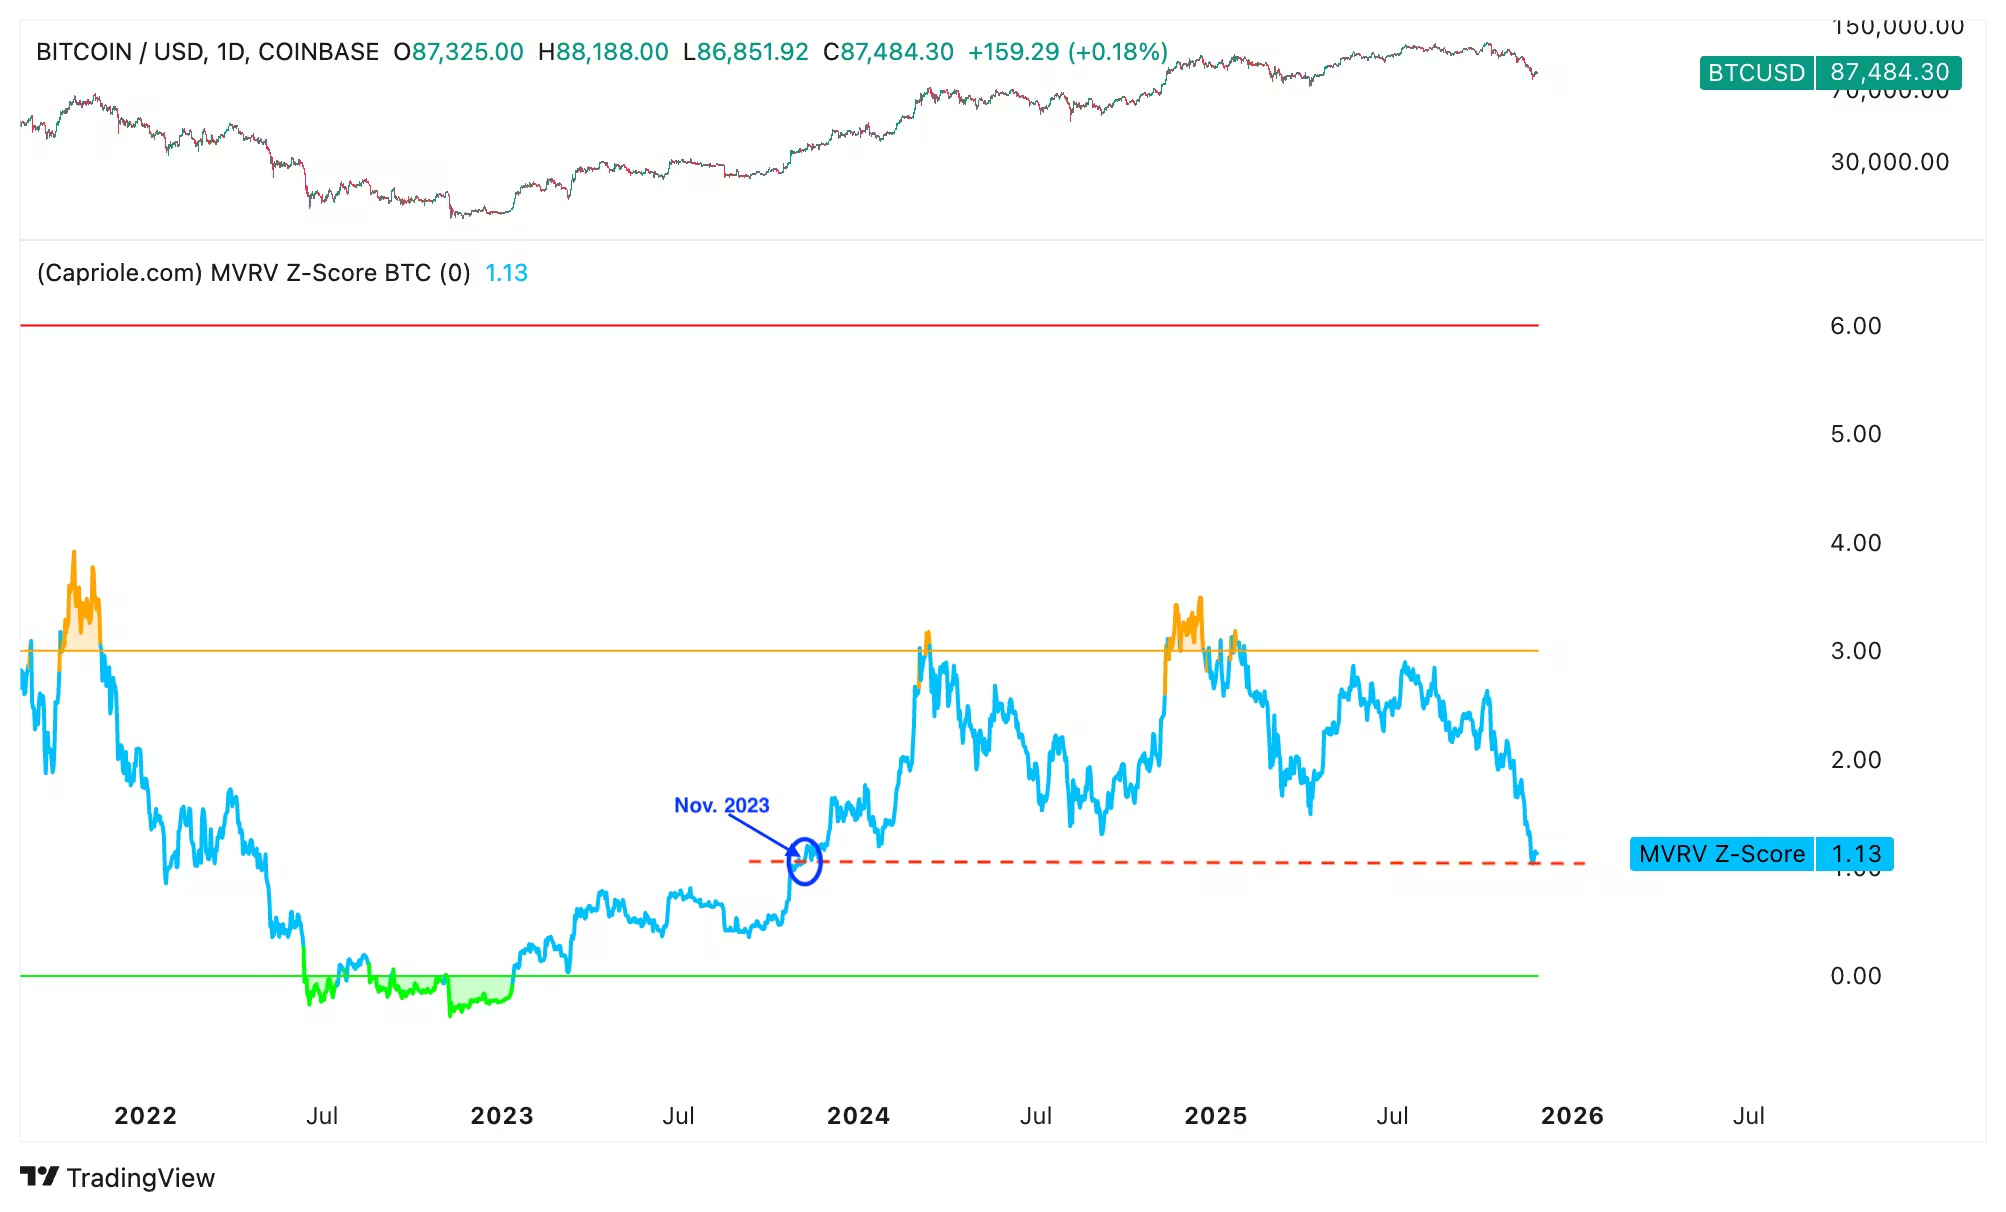
Bitcoin MVRV Z-score
Previous drawdowns that reset market psychology were accompanied by similar MVRV Z-Score behavior; once the metric crossed below the green threshold, it frequently preceded strong multi-week rallies. For traders watching macro on-chain signals, a low MVRV Z-Score can indicate that market participants are being offered BTC at prices below long-term realized cost basis.
Technical setup: bull flag targets roughly $96K
From a technical standpoint, the BTC/USD price chart has formed a classic bull flag pattern. After breaking above the flag’s upper trendline at about $87,200, BTC began retesting that level to confirm the breakout. Cointelegraph Markets Pro and TradingView data place a measured flag target near $96,800 — roughly a 10.6% upside from current levels if the breakout holds.
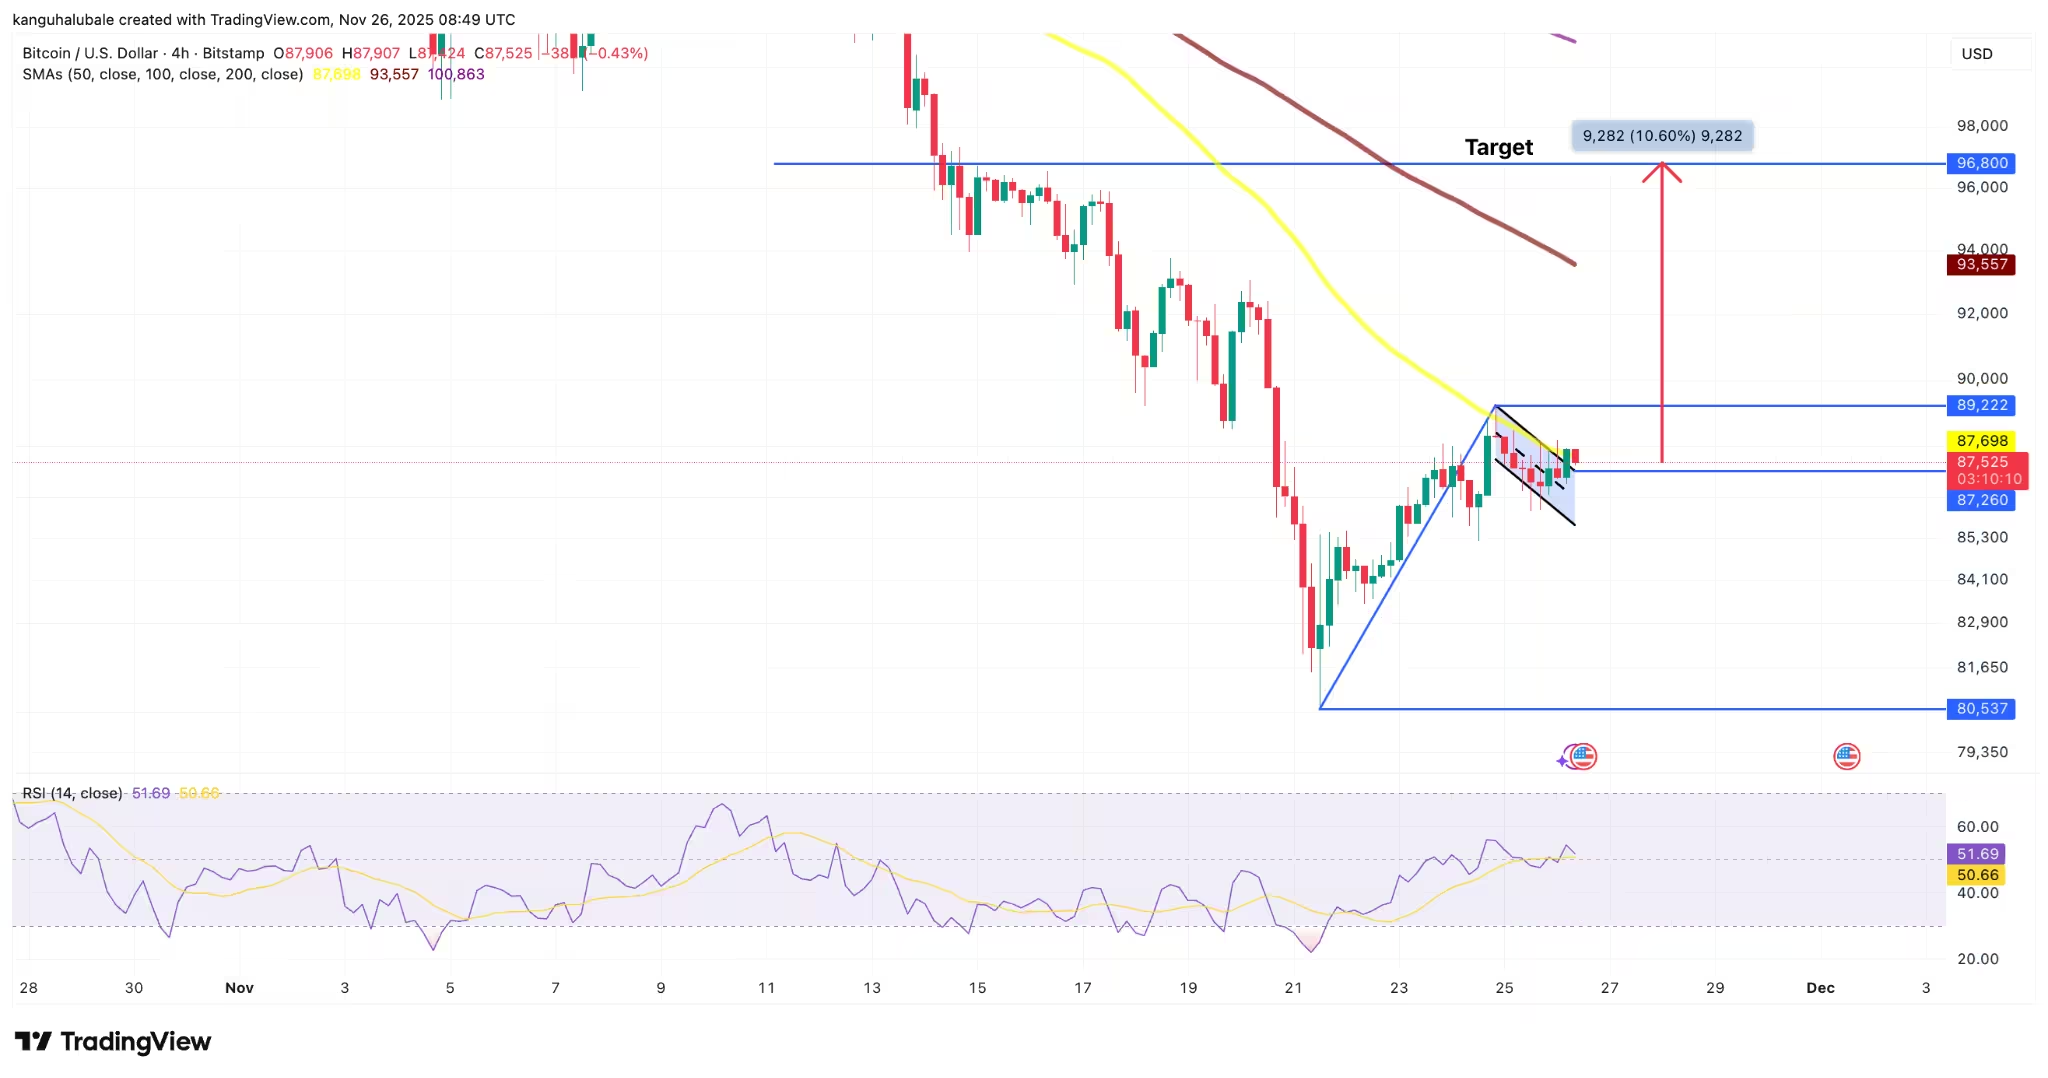
BTC/USD four-hour chart
Additional technical support comes from the relative strength index (RSI), which recovered from oversold territory and climbed to 51, signaling growing bullish momentum. That momentum, aligned with on-chain undervaluation signals, builds a compelling short-term bullish case for crypto traders.
Risks and counterarguments
Despite bullish signs, veteran traders urge caution. Peter Brandt and others pointed out that rebounds to $89,000 could amount to a “dead cat bounce” before further downside. There remains the possibility of a final leverage flush below $80,000 as the market digests recent liquidations and margin pressures. For risk-managed exposure, traders should monitor liquidity, open interest, and miner behavior closely.
What traders and investors should watch next
Key levels and indicators to monitor include the Puell Multiple around the discount threshold, the MVRV Z-Score crossing the green line, confirmation of the $87,200 breakout on the four-hour chart, and macro liquidity events such as leverage flushes under $80,000. Combined, these on-chain and technical signals provide a balanced view: upside toward the mid-$90,000s is plausible, but traders should remain prepared for volatility and potential retests of lower support.
Overall, the convergence of the Puell Multiple, MVRV Z-Score, and a bull flag pattern presents a compelling narrative for a short-term Bitcoin rebound, while still acknowledging the persistent risk of another leg down in a fragile market environment.
Source: cointelegraph
Comments
datapulse
Feels kinda optimistic, bull flag target neat but history shows fake breakouts. Good data tho, just dont deploy all capital now. risk still high
coinpilot
Hmm is Puell + MVRV really signalling a bottom? Looks plausible but miners could still dump, and $87k breakout feels shaky. anyone else skeptical?
Leave a Comment