
5 Minutes
Ethereum price stalls under $3,000 as staking interest cools
Ethereum failed to reclaim the $3,000 mark on Nov. 26, closing the session near $2,938 as investor appetite for staking wanes. The second-largest crypto by market cap now sits around $354.5 billion, trading roughly 40% below its August all-time high and showing nearly a 30% decline over the past month. With weaker staking inflows, ETF redemptions and technical bearish signals piling up, bulls face an uphill battle to regain control.
Key takeaways
- Ethereum price is down roughly 30% over the last month.
- Staked ETH inflows have fallen sharply since late October.
- A death cross is forming on the daily chart, signaling deteriorating momentum.
Price action and staking flows
Ethereum climbed to an intraday high of $2,973 on Nov. 26 but could not overcome the psychological resistance at $3,000, leaving traders watching for the next directional cue. Staking inflows — the metric tracking ETH moving off exchanges to be locked in staking contracts — have collapsed from about $160,000 near the end of October to roughly $2,941 today, according to CryptoQuant data.

Lower inflows suggest fewer holders are opting to lock capital into the network, reducing the supply impact that staking normally provides. As a proof-of-stake asset, ETH benefits when investors move tokens off exchanges to stake, because that reduces circulating supply and is typically supportive for price. With yields low and competing proof-of-stake networks offering higher returns, many traders appear to be reallocating.
Staking yields and competitive pressure
Annual staking yield for Ethereum currently sits around 1.9–2%. That is materially lower than yields on several rival chains: Avalanche offers about 4.7%, Solana roughly 4.2%, and niche projects like Bittensor report much higher advertised yields. Lower yield combined with a higher perceived entry price has made staking ETH less attractive for yield-seeking investors, adding selling pressure or keeping ETH liquid on exchanges.
Institutional flows and ETF redemptions
Institutional behavior has amplified the weakness. Ethereum ETFs have recorded net outflows totaling around $1.56 billion since the start of November. These outflows show that some institutional investors who had previously provided a steady bid via ETF exposure are reducing positions, which removes a layer of support from price action and increases downside risk.
Technical outlook: death cross and patterns to watch
On the technical front, Ethereum is presenting multiple bearish formations on the daily chart. The 50-day simple moving average is nearing a crossover with the 200-day SMA, which would create a so-called death cross — a pattern often associated with extended downtrends and weakening market momentum.
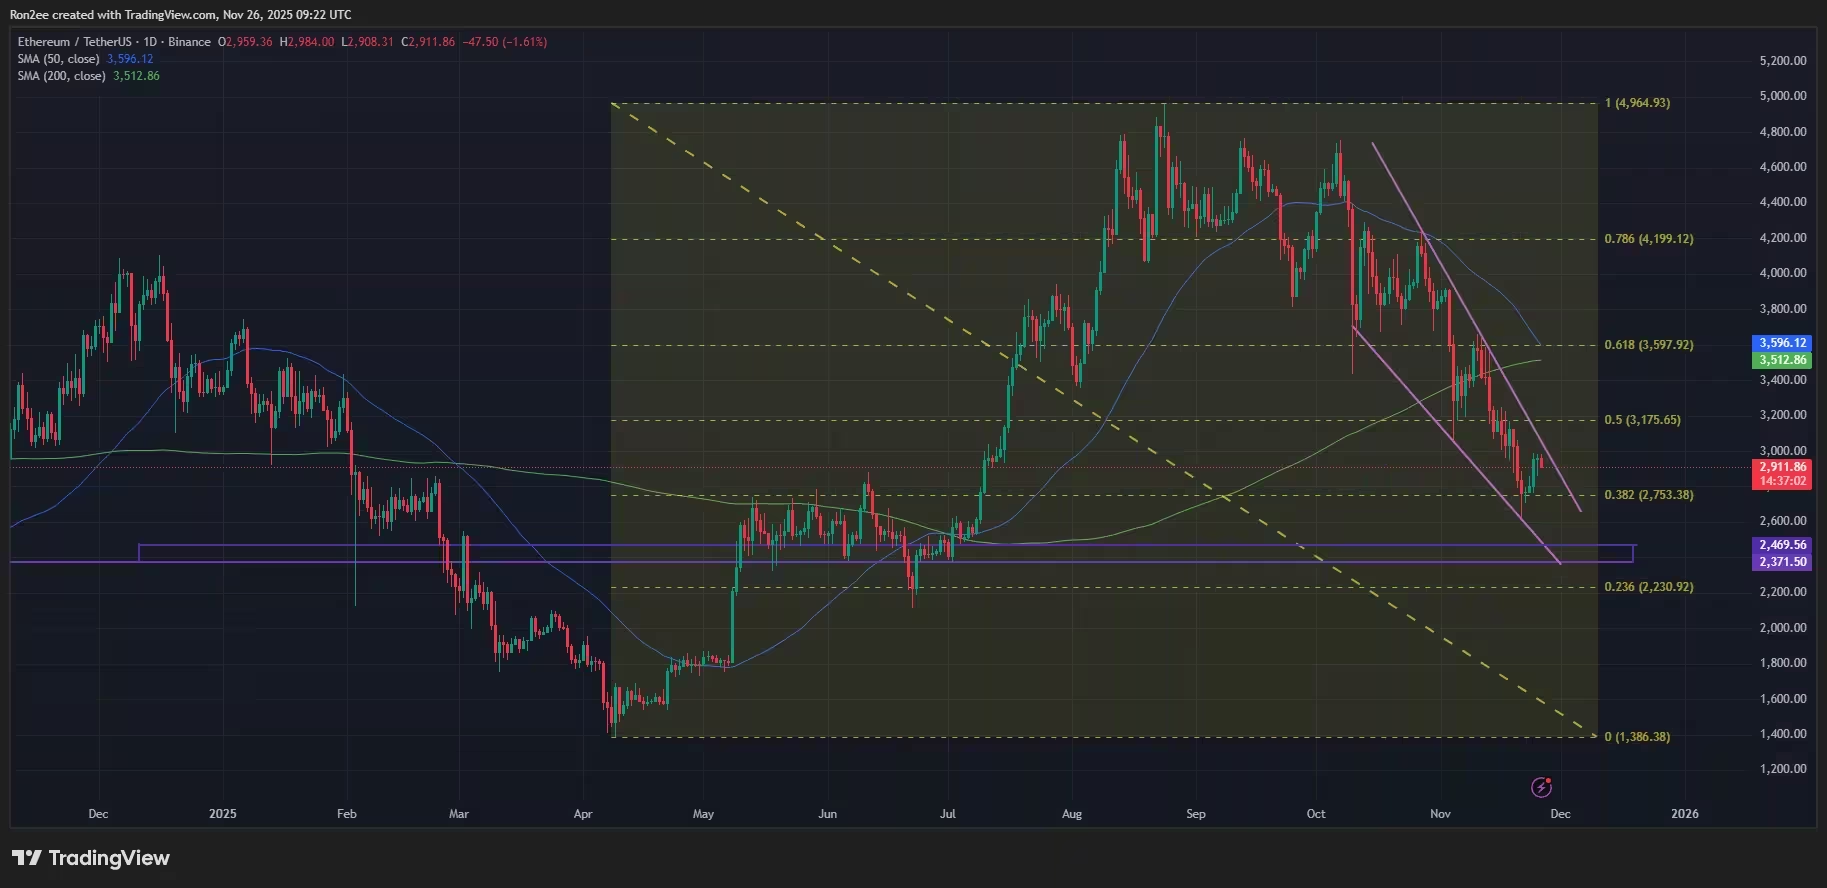
Ethereum price is forming a death cross pattern on the daily chart — Nov. 26
Additionally, the price action shows signs of a rounded top and a falling wedge. A rounded top typically indicates exhaustion among buyers and can precede a prolonged pullback. Conversely, a breakout from the falling wedge with strong volume could signal a bullish reversal, so traders are monitoring both scenarios closely.
Support and resistance levels to watch
Short-term resistance remains at the $3,000 area. On the downside, the $2,370–$2,470 range has historically acted as a significant support zone earlier this year and is now a key level for bulls to defend. A decisive break below that range could open the door to deeper losses and potentially accelerate the bearish setup implied by the moving averages.
What could turn the trend?
Several factors could shift the outlook. A meaningful pickup in staking inflows or a return of ETF inflows would bolster demand and reduce available supply, helping price recover. Technical confirmation — namely a breakout above the falling wedge with increased volume or a failure of the death cross to exert follow-through — could also restore bullish momentum.
For now, Ethereum remains under pressure from weaker staking demand, competitive PoS yields, and institutional outflows. Traders should watch staking metrics, ETF flow data, and the $2,370–$3,000 band for signs of either a deeper correction or a sustainable recovery.
Source: crypto
Comments
Marius
Whoa didnt expect ETH to drop 30% in a month... staking yields at 1.9% kinda kills the incentive, no wonder ppl move to Solana/Avalanche. Oof
coinpilot
Wait, staking inflows from 160k to 2.9k? sounds insane, is that really correct or a data hiccup? ETF redemptions explain some pressure, but the death cross could scare more sellers
Leave a Comment