
3 Minutes
Ethereum price pauses near $3,000 as ETFs record net outflows
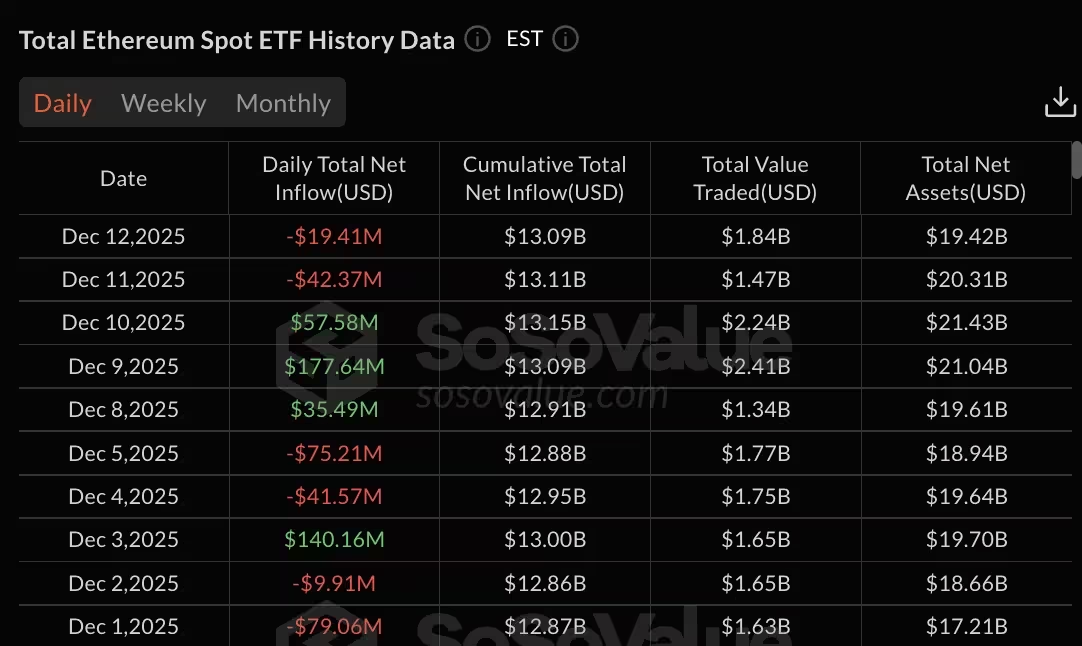
Ethereum stalled around the $3,000 mark on December 12 as spot ETH exchange-traded funds (ETFs) logged $19.41 million in net outflows. Traders and investors showed mixed behavior across providers, producing short-term selling pressure that coincided with a pullback in ETH price. The token traded at $3,157 within a 24-hour range of $3,054.43 to $3,261.13, slipping 5.4% over the past day and 12.6% over the last 30 days.
ETF flow breakdown and fund-level activity
Although December 9 and 10 saw substantial inflows — $177.64 million and $57.58 million respectively — the market reversed later in the week with $42.37 million of outflows on December 11 and $19.41 million more on December 12. BlackRock's ETHA was the day's standout inflow, attracting $23.25 million, while Grayscale funds led withdrawals: the legacy ETHE trust recorded $14.42 million in redemptions and Grayscale's mini ETH trust posted $22.10 million in outflows.
Fidelity's FETH recorded $6.14 million in outflows for the day. Several smaller ETFs, including Bitwise's ETHW, VanEck's ETHV, Franklin's EZET, 21Shares' TETH, and Invesco's QETH, showed no measurable flow activity on December 12.
Assets under management and cumulative flows
BlackRock's ETHA remains the largest Ethereum spot ETF with roughly $13.23 billion in cumulative net inflows. Grayscale's ETHE still shows a cumulative net outflow of about $5.02 billion since its conversion from a trust, while Fidelity's FETH has accumulated about $2.66 billion in total inflows.
Total net assets under management across Ethereum spot ETFs stood at $19.42 billion on December 12, with cumulative net inflows across all funds at $13.09 billion year-to-date and total value traded at $1.84 billion on the day.
Technical picture: analysts see bullish setup despite short-term weakness
Market analysts have flagged a potentially bullish technical formation on ETH charts. Donald Dean identified an inverse head and shoulders pattern that targets $4,955.90 — roughly a 57% rise from current levels — if the pattern completes and bullish continuation follows. Dean noted price action launching from a volume shelf and moving toward a $3,300 volume area as a potential launch zone.
Another analyst, Ted, highlighted concentrated liquidity clusters at key price zones. He pointed out a sizable liquidity cluster at $3,000, with additional clusters near $3,150 and $3,250 that may act as short-term resistance. Ted suggested the market could sweep downside liquidity around $3,000 before reversing higher, mirroring recent Bitcoin dynamics where liquidity hunts preceded strong moves up.
What traders should watch
Traders and crypto investors should monitor ETF flow reports, AUM updates, and intraday liquidity behavior around $3,000. Key resistance bands at $3,150–$3,250 and the $3,300 volume shelf will be important for validation of any breakout. On-chain signals, ETF inflows/outflows, and technical patterns like the inverse head and shoulders offer a combined framework to gauge potential medium-term upside for Ethereum within the broader blockchain and crypto market.
Source: crypto
Leave a Comment