
4 Minutes
BitMine's Tom Lee: Ethereum May Be Approaching a Bottom
BitMine executive Tom Lee told Consensus attendees that Ethereum's latest sell-off appears to mirror previous major declines, and historical patterns suggest a rapid, V-shaped recovery is possible. Lee pointed to repeated instances since 2018 when ETH dropped more than 50% and then bounced back strongly, arguing that the current drawdown could be near exhaustion.
Technical undercut near $1,890 could mark a low
Citing market timer Tom DeMarc's analysis, Lee highlighted an 'undercut' level around $1,890 as a potential technical signal for a perfected bottom. That level would represent a final shakeout that often precedes a meaningful recovery in volatile markets like crypto. Lee encouraged traders and investors to look for opportunity rather than panic if price action revisits those lows.
If history repeats, Lee believes the fundamental outlook for Ethereum and the broader blockchain ecosystem has not changed. He emphasized that the recent weakness is primarily price action, not a shift in Ethereum's long-term use cases, network adoption, or progress on scaling and decentralization initiatives.
Current price action: support, momentum, and resistance
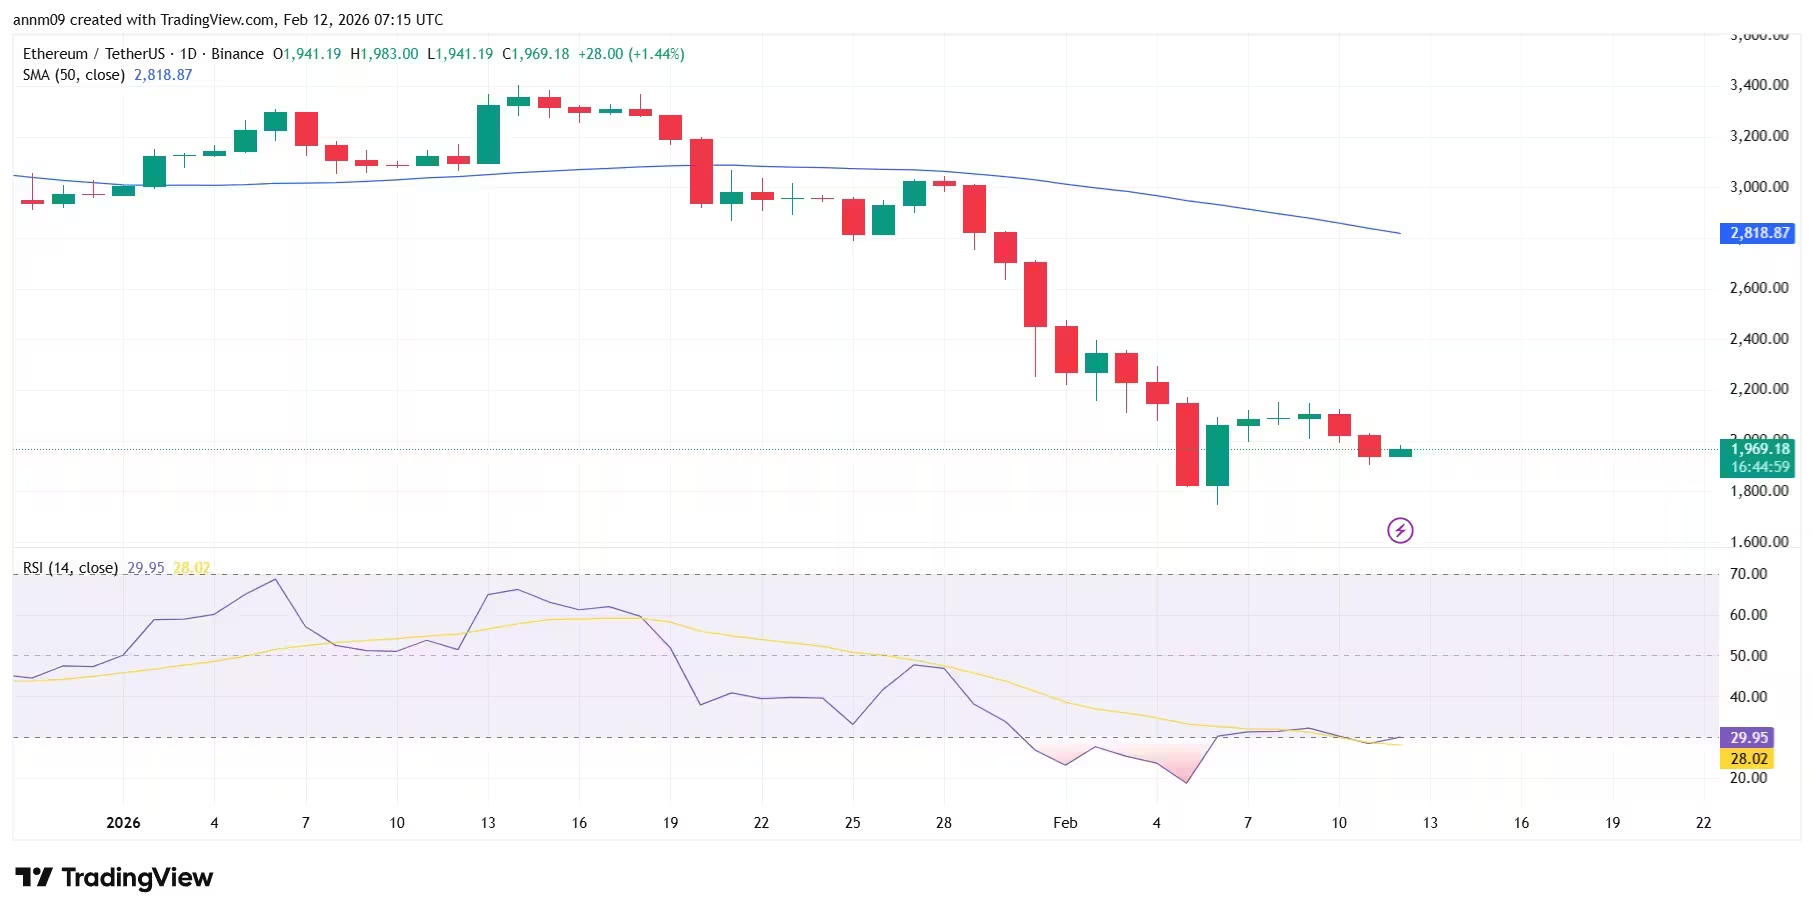
Ethereum is trading near the $1,900 support zone, with recent sessions displaying a tight range and lower intraday volatility. At the time of reporting, ETH hovered near $1,965, reflecting a market that has paused after substantial selling pressure. Market participants are watching key technical signals to judge whether selling momentum is truly fading.
Ethereum price performance
Momentum indicators and moving averages
The daily Relative Strength Index (RSI) has lifted off deeply oversold levels, suggesting that aggressive selling is slowing. RSI remains below the neutral 50 mark, which indicates buyers have not yet reclaimed control, but the rebound is a constructive sign for short-term stabilization.
ETH sits well below its 50-day simple moving average, currently near $2,800, which acts as prominent overhead resistance. This wide gap underscores the extent of the recent correction and the challenge bulls face in regaining medium-term trend control.
Support and resistance levels to watch
Short-term price structure looks to be forming a base in the $1,850–$1,900 range, an area where buyers have repeatedly defended dips. A decisive break below $1,850 would weaken this setup and could open the way toward the next support zone around $1,750.
On the upside, immediate resistance sits at the $2,000 psychological level, which has capped several recovery attempts. Above that, stronger supply is expected near $2,100–$2,150, and reclaiming the 50-day moving average would be a more bullish technical development.
What this means for traders and investors
Tom Lee's outlook is cautiously optimistic: historical precedent and technical undercut levels point to the possibility that a bottom may be forming. Traders focused on technical analysis, momentum, and support/resistance levels may find actionable setups near the $1,850–$1,900 zone, while longer-term investors should weigh fundamentals such as Ethereum network activity, staking trends, and DeFi growth.
Risk management remains critical in the volatile crypto market. Position sizing, stop-loss discipline, and a clear thesis for entries and exits are important whether participants are looking to trade short-term bounces or accumulate ETH on weakness.
Source: crypto
Leave a Comment