5 Minutes
XRP technicals point to potential move under $1
XRP looked vulnerable after being rejected near $1.40, with chart technicians warning that a slide below $1 could play out in the coming weeks. The token has pulled back roughly 63% from its multi-year high of $3.66 and was trading around $1.36 on Wednesday — a retracement that some analysts say may carry bearish implications for price action.
Key takeaways
- XRP showed bearish signs under $1.40, with technical setups pointing to a potential decline toward $0.70–$1.00.
- Ongoing spot XRP ETF inflows, increased whale accumulation and rising active addresses could negate the downside case.
- Watch levels: failure to hold local lows near $1.12 would validate a deeper retracement.
Where could XRP find a bottom?
In a post on X, analyst Chart Nerd pointed to recurring fractal patterns from the monthly Gaussian Channel indicator as evidence that XRP may correct further before stabilizing. The Gaussian Channel is commonly used to identify trend channels, potential support and resistance bands, and overbought/oversold zones.
Chart Nerd noted that past rallies have tended to correct back to the upper regression band of the Gaussian Channel — currently near $1.16 — before entering several months of additional downside toward the center regression band. That middle band is presently around $0.70 and coincides with a year-long resistance area from 2023–2024 that has not yet been retested as support. The analyst cautioned that a break below the recent local low of $1.12 would lend credibility to the deeper retracement scenario.
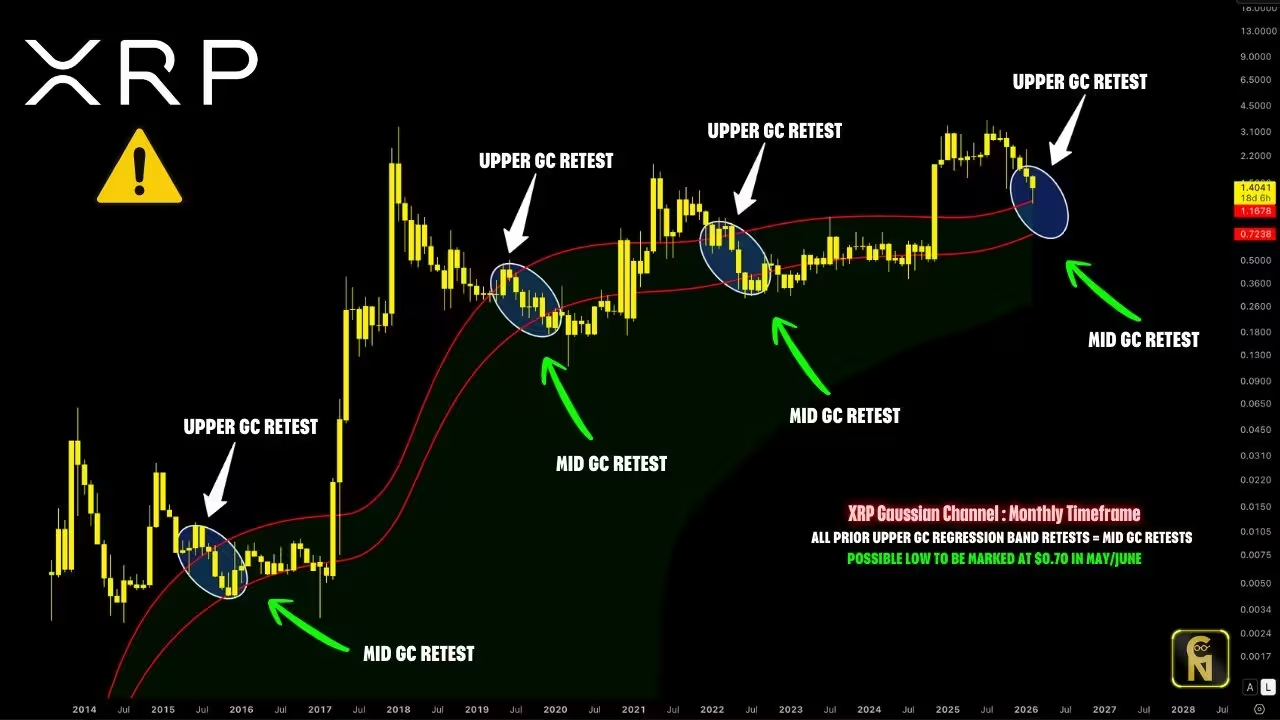
XRP/USD monthly chart depicting the Gaussian Channel.
Analyst views on accumulation zones
Crypto Patel, another technical analyst, said a retreat to $1 could offer a reasonable entry for buyers, while labeling $0.50–$0.70 as the “best accumulation zone” if momentum deteriorates further. Patel argued that while XRP is down roughly 70% from its recent all-time high, another extreme crash like the 2018 drawdown (96% from $3.28 to $0.1050) is unlikely. Still, a corrective retracement below $1 remains a plausible outcome on the charts.
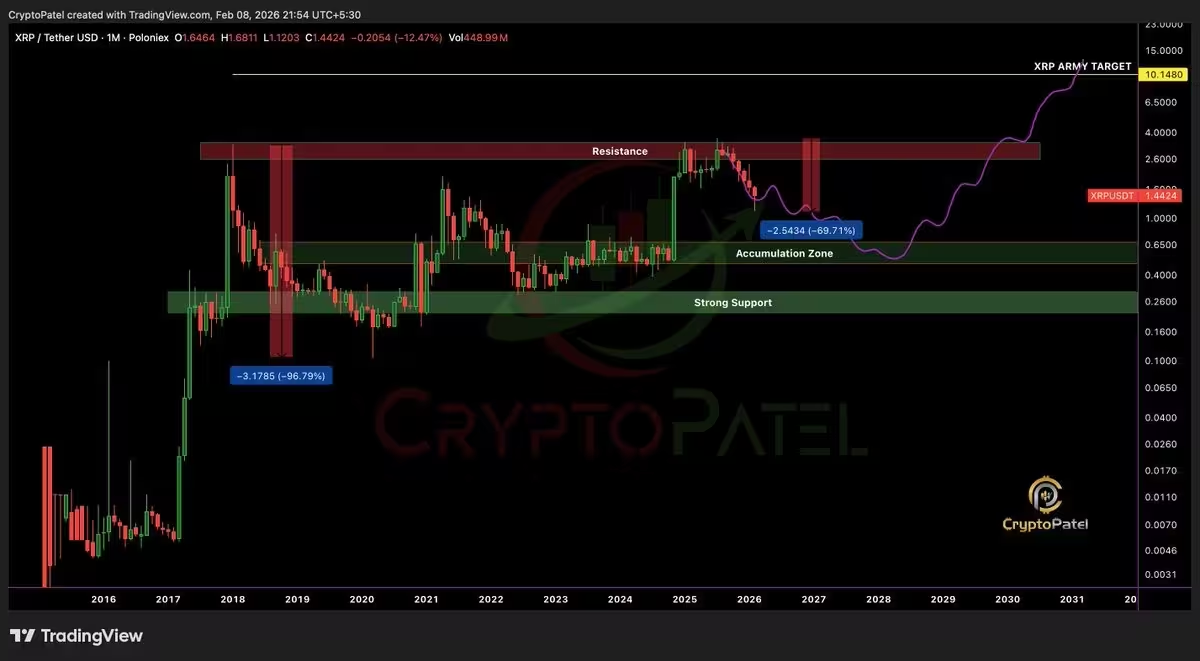
XRP/USD monthly chart.
What could invalidate the bearish outlook?
Despite technical pressure, several on-chain and institutional indicators show resilience. Spot XRP ETFs — launched in late 2025 — have accumulated significant net inflows, reaching $1.23 billion in cumulative inflows. Recent daily inflows continued for five straight days, and assets under management climbed above $1.0 billion. Trader Levi highlighted persistent ETF net inflows as a sign of ongoing institutional confidence in XRP.
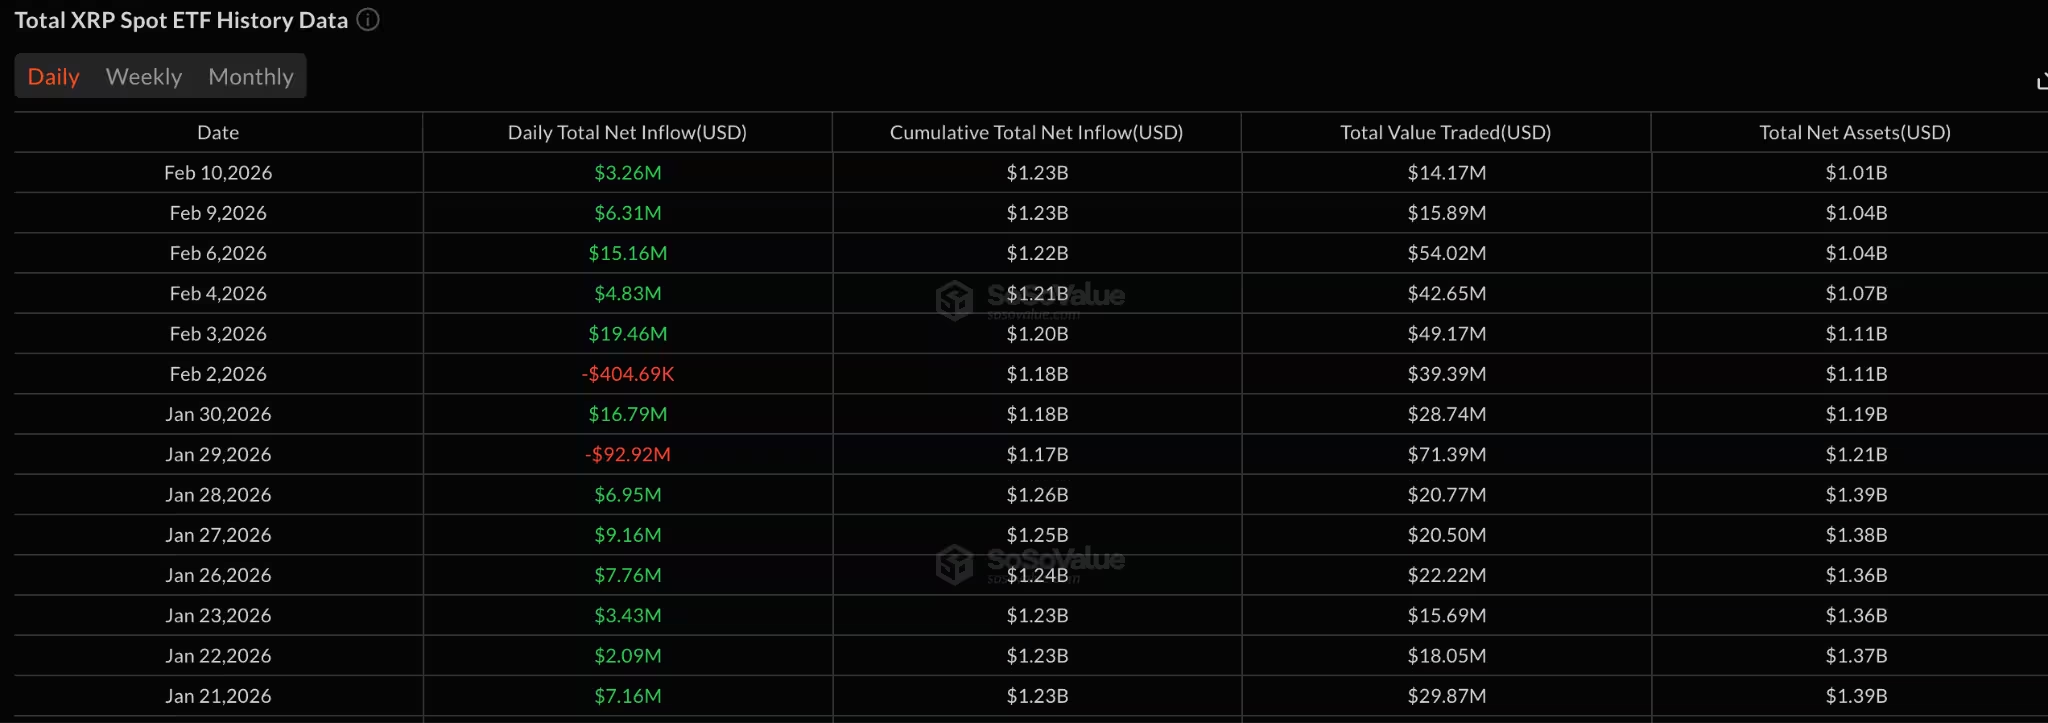
Spot XRP ETFs flows table.
On-chain metrics add another bullish counterpoint. Santiment reported that whale transactions for amounts greater than $100,000 in XRP spiked to four-month highs (1,389 transactions), suggesting large holders were accumulating during the pullback. The number of active addresses on the XRP Ledger also surged, with 78,727 active addresses recorded in a single eight-hour candle — the highest in six months. Santiment called both metrics “major signals of a price reversal for any asset.”
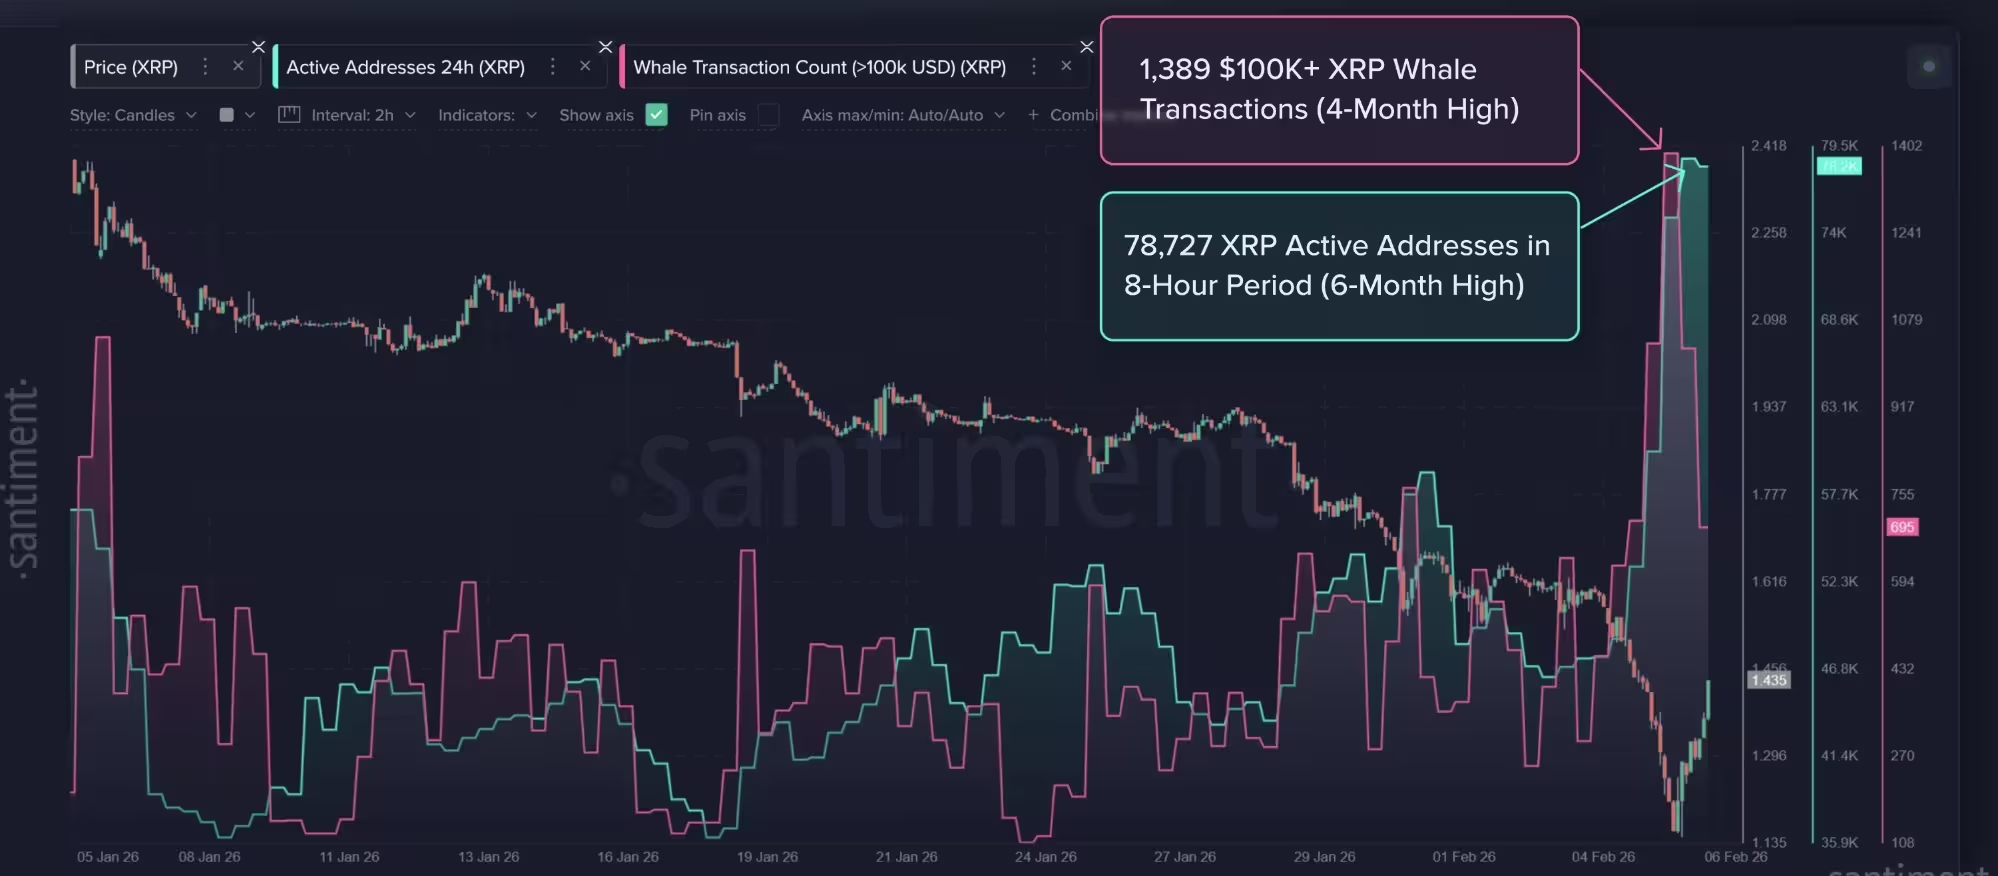
XRP daily active addresses and whale transactions.
How traders should approach risk
For traders and investors, the immediate risk-reward is defined by price reaction to the $1.12–$1.40 zone and the 200-week moving average, which previously rejected price near $1.40. A sustained break below $1.12 increases the probability of a test of the $0.70 middle Gaussian band. Conversely, continued spot ETF inflows, rising whale accumulation and expanding active addresses would reduce downside risk and could set the stage for renewed upside momentum.
In short, technicals currently leave the door open for a drop below $1, but institutional demand and improving on-chain activity are credible factors that could invalidate the bearish thesis. Traders should monitor ETF flows, whale transactions, active address trends and Gaussian Channel support levels to gauge the next meaningful directional move for XRP.
Source: cointelegraph
Comments
Marius
Is that Gaussian Channel pattern legit or just pattern-chasing? ETFs piling in is solid, but charts lie sometimes, will wait for $1.12 break.
blocktone
Whoa, seeing XRP flirt with sub $1 gives me chills. If $1.12 cracks, a slide to 0.70 looks real... but ETFs + whales could flip it, nervy.
Leave a Comment