

8 Minutes
Bitcoin holds near $79,200 as drawdowns narrow
Bitcoin traded around $79,200 on Sept. 9 after a sharp recovery from its June low, a move that supports the view that the latest downturn has been significantly shallower than the large bear markets that followed the 2017 and 2021 peaks. Market participants and market makers have pointed to a mix of institutional demand via spot Bitcoin ETFs, changing market structure and healthier liquidity as reasons the current cycle’s drawdown has been less severe.
Key takeaways
- Bitcoin price was roughly $79,200 on Sept. 9, about 37% below the October 2025 all-time high near $125,653.
- Wintermute and other desks estimate the current cycle’s deepest drawdown near 50%, far smaller than the 77%–83% collapses recorded in prior cycles.
- After the August rebound, the real-time drawdown from the October 2025 high is closer to 37%.
- U.S. spot Bitcoin ETFs posted around $987 million in net inflows during the week to Sept. 4, marking a third straight positive week.
- Stronger U.S. payrolls in August (162,000 jobs added; unemployment 4.1%) added macro pressure ahead of the Fed meeting.
Understanding the drawdown numbers
When traders and analysts discuss drawdowns, precision matters. Wintermute’s comment that Bitcoin “sits 50% below peak” refers to the largest drop observed during the current cycle or to a snapshot at a specific comparison point, not necessarily to the spot price on Sept. 9. At $79,200, BTC is about 37% below the verified October 2025 record of approximately $125,653. That gap is meaningful when evaluating whether markets are still in a deep capitulation phase or have moved into a more sustained recovery.

Historical comparisons show a clear difference. The 2018 cycle bottomed with roughly an 83% collapse from its high, and the 2022 bear market saw declines near 77%. Wintermute’s analysis and independent historical price series (for example, Hashrate Index) indicate the current cycle’s largest trough approached the 50% mark, but the August rally tightened that drawdown materially.
Put simply: the deepest point reached earlier in the cycle was close to a 50% loss for BTC, but the recovery that followed reduced the real-time deficit. This nuance matters for investors weighing whether structural market changes—like ETF access—have permanently altered downside risk.
Spot Bitcoin ETFs: how much did they matter?

One of the prime explanations for shallower bottoms this cycle is the arrival of U.S. spot Bitcoin ETFs. These funds provide a regulated, familiar channel for pensions, advisers, hedge funds and wealth managers to allocate to BTC without custodying coins directly. That on-ramp creates incremental, institutional demand that was absent in prior bear markets.
During the week ending Sept. 4, U.S. spot Bitcoin ETFs reported about $987 million in net inflows, according to flow trackers. That week represented the third positive weekly inflow in a row for these products, bringing cumulative inflows across the multi-week recovery to roughly $3.8 billion. Large daily moves (for example, a $731 million inflow on Sept. 3 followed by $175 million on Sept. 4) show the flows can be lumpy and concentrated.
These inflows matter for price discovery and liquidity. ETF demand can help absorb selling pressure during drawdowns and provide buy-side support in rallies. But it is also important to recognize limitations: ETF shares can be sold quickly, and large redemptions during risk-off episodes could exacerbate volatility and amplify downward pressure. In other words, institutional participation deepens the market, but it does not eliminate the possibility of steep drawdowns under extreme stress.
What ETFs prove — and what they don’t
The ETF flow data demonstrate that regulated products provided meaningful demand during the recovery period. They do not, however, conclusively prove that ETFs established the June bottom or permanently reduced downside risk. That would require a sustained pattern of inflows across multiple stress events and clear evidence that ETF participation anchors price discovery even when macro conditions turn adverse.
Macro backdrop: payrolls, Fed expectations and liquidity
Macro data continue to play a major role in Bitcoin price action. The stronger-than-expected U.S. employment report for August showed nonfarm payrolls rising by 162,000 and the unemployment rate holding at 4.1%. Average hourly earnings rose 0.3% for the month and 3.1% year-over-year. Those figures reduced immediate market expectations for Federal Reserve easing and briefly pressured risk assets, including crypto.
Bitcoin dropped from around $82,400 to below $80,000 after the payrolls release, then stabilized and retained part of its weekly gains. Market makers like Wintermute interpreted that resilience as evidence of underlying demand—crypto did not collapse despite repriced rate expectations. Still, one reaction to jobs data does not guarantee lasting decoupling from macro forces. Bitcoin remains sensitive to interest rates, bond yields, the U.S. dollar and liquidity expectations.

Separately, the U.S. Treasury increased the maximum size of its long-term securities buyback auctions (10–30 year notes) from $2 billion to at least $4 billion through early November. While buybacks can improve liquidity in the Treasury market, they are not equivalent to direct monetary stimulus and do not represent new purchases of crypto assets.
Technical picture: momentum cooling near $79,000
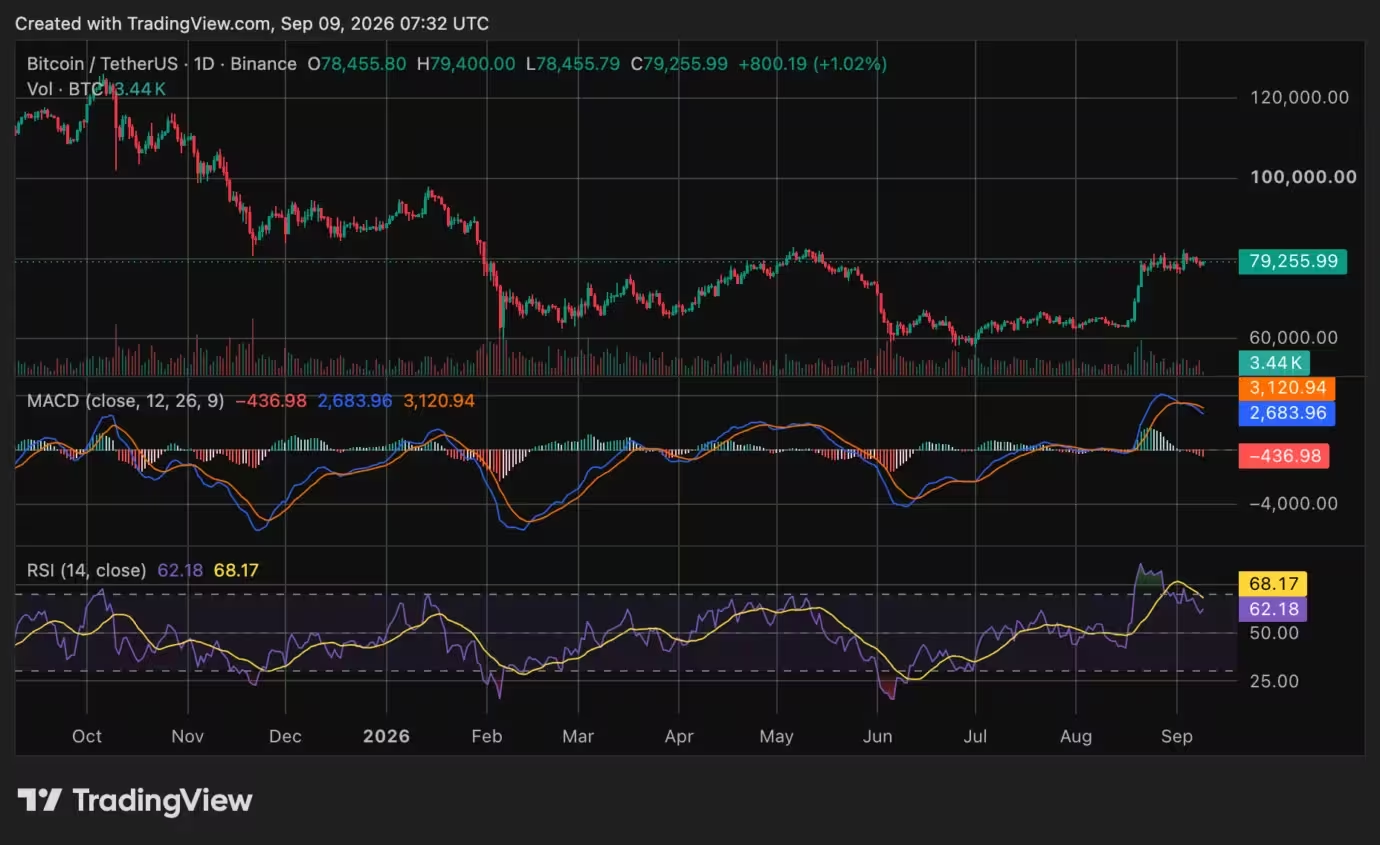
Bitcoin’s August rebound pushed price above its 200-day simple moving average, signaling a constructive shift in the longer-term trend. After reclaiming that moving average, BTC briefly approached the low $83,000s before consolidating near $79,000.
On standard momentum indicators, the relative strength index (RSI) fell from loftier levels and sat around the low 60s, below a moving average of prior RSI readings that were closer to the high 60s. An RSI above 50 still implies positive momentum, but the drop from higher readings indicates buying pressure has cooled.
The MACD (moving average convergence divergence) setup showed short-term momentum weakening: the MACD line crossed below its signal line and the MACD histogram moved negative, while both main MACD lines remained above zero. This typically reflects a pullback within a broader recovery rather than signaling a full bearish reversal.
Trading volume declined as BTC moved toward $79,000, suggesting fewer participants chased the rebound. Lower volume during consolidation increases the importance of nearby support and resistance levels—the balance of orderflow will determine whether the rally resumes or the correction deepens.
Bitcoin (BTC) price chart

Important levels to watch
- Immediate resistance: $82,000–$83,000. Clearing this range would strengthen the constructive case and could attract renewed buying momentum.
- Key support: $72,000. A sustained move below this level would undermine the bullish interpretation and could open the door to deeper correction.
These reference points are useful for traders and portfolio managers, but they are not immutable rules. Market structure, liquidity, macro shocks and ETF flows will all influence how price reacts around these thresholds.
Market breadth, rotation and sector dynamics
Wintermute and other market observers also point to improved breadth and rotation across crypto sectors. During the recovery, capital appears to have rotated out of mature trades into newer thematic pockets. For example, artificial intelligence-related tokens and decentralized physical infrastructure projects outperformed, while decentralized finance (DeFi) and several Layer 2 tokens lagged.
This uneven rally fits the profile of a market still in the process of discovery: winners emerge early as investors search for new growth angles while previously dominant sectors consolidate. If breadth continues to widen and more sectors participate, that would be a healthier sign for a durable recovery. Conversely, concentration in a few high-performing verticals could leave the market vulnerable to sentiment shifts.
Outlook and events to watch
Several catalysts will test the thesis that bottoms are becoming shallower in crypto cycles:
- Federal Reserve meeting (Sept. 15–16): The FOMC decision, economic projections and the press conference will be the first major macro event after the payrolls print. A hawkish tone or higher-than-expected inflation projections could lift bond yields and pressure risk assets, including Bitcoin. A dovish or neutral message could ease rate expectations and support price.
- Next inflation releases: CPI and other inflation indicators will shape the rate outlook and liquidity expectations that matter for BTC.
- ETF flow persistence: Continued net inflows into spot Bitcoin ETFs would bolster the argument that institutional capital is entering earlier during drawdowns. Conversely, sustained outflows would weaken that thesis, especially if accompanied by price weakness below $72,000.
- Market breadth and volume: A recovery that widens participation across sectors and restores trading volume would be a constructive sign. Renewed concentration and low volume would increase the risk of reversal.
Conclusion

The available evidence supports a narrow conclusion: the deepest drawdown during the current cycle was much smaller than the catastrophic collapses of 2018 and 2022, and the real-time drawdown has narrowed further after August’s rally. Spot Bitcoin ETFs and other institutional channels have likely played a meaningful role in providing demand and liquidity, but they do not guarantee the elimination of future deep drawdowns.
Macro variables, ETF flows and price action around key technical levels—particularly $82,000 on the upside and $72,000 on the downside—will determine whether Bitcoin’s shallower decline so far becomes a durable feature of this cycle. Traders and investors should monitor these variables closely, maintain risk management discipline and avoid conflating a single recovery leg with a definitive structural shift in market risk.

Leave a Comment
Comments (1)
Wow, didn’t expect the drawdown to be that shallow after June. ETFs really changing the game? if that's real then this cycle feels different, kinda exciting but nervous too