

5 Minutes
Bitcoin slips below $79,000 amid fading short-term momentum
Bitcoin traded near $78,900 as of the latest session after a pullback from the early-September highs above $81,000. Short-term momentum has cooled, and concentrated liquidity on both sides of the market is increasing the odds of a sharp intraday swing. Traders are watching key technical indicators and liquidation clusters closely for clues on where BTC might move next.
Market snapshot
BTC opened the recent period around $81,271 on Sep. 4 and made an intra-period high above $82,000, but that advance failed to hold. The price briefly reached $78,455 during the latest daily session before buyers stepped in and pushed levels back closer to $79,000. The six-day pullback looks like a consolidation after a stalled rally rather than a clear breakdown of the longer-term recovery.
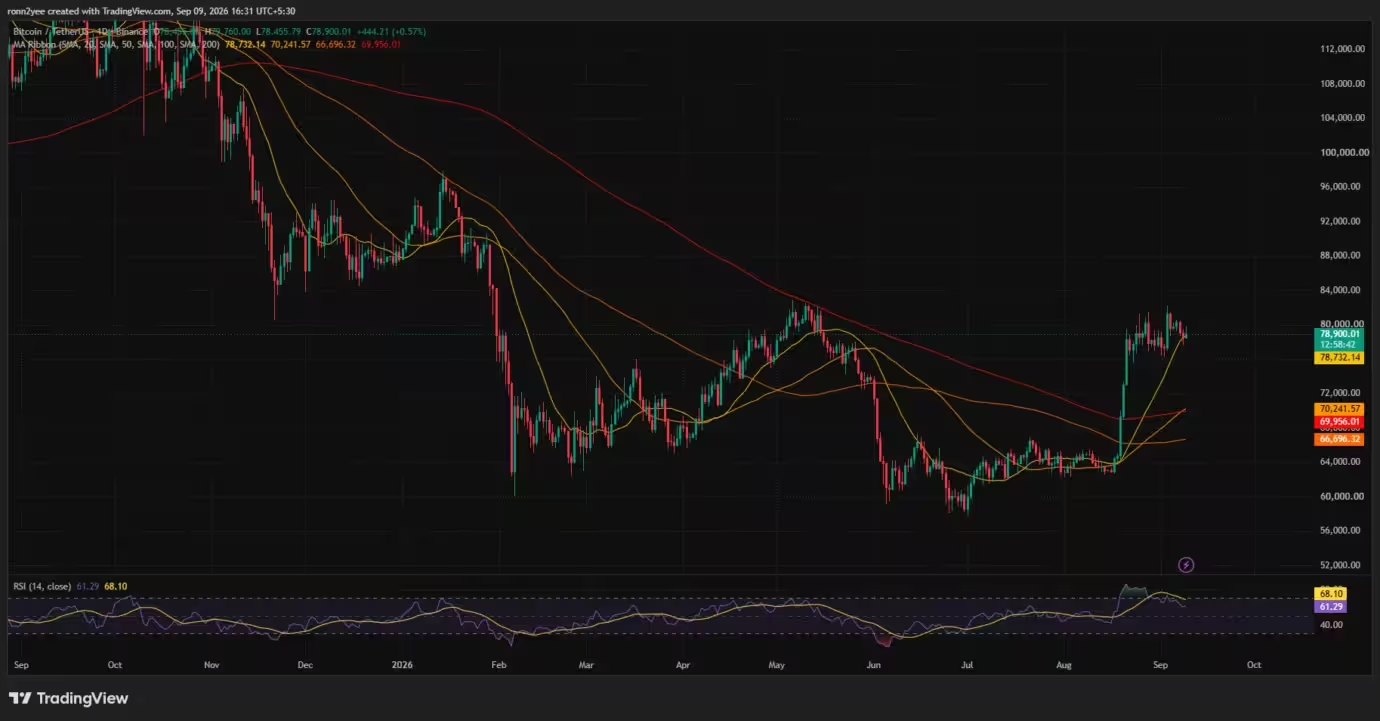
Bitcoin remains positioned above several longer-term moving averages. The 10-day simple moving average sits near $78,732, while the 20-day SMA is considerably lower around $70,242. Meanwhile, the 50-, 100- and 200-day SMAs cluster between roughly $66,700 and $70,000, suggesting that the broader uptrend is intact even as short-term momentum cools.
Bitcoin price daily chart — Sep. 9
Daily relative strength has eased as RSI pulled back from recent peaks. The daily RSI sits above neutral but below its shorter-term signal average, signaling that buyers have lost some steam since BTC tested resistance near $82,000. This deterioration in momentum increases the need for traders to monitor support and resistance bands closely.
4-hour indicators point to weak trend strength
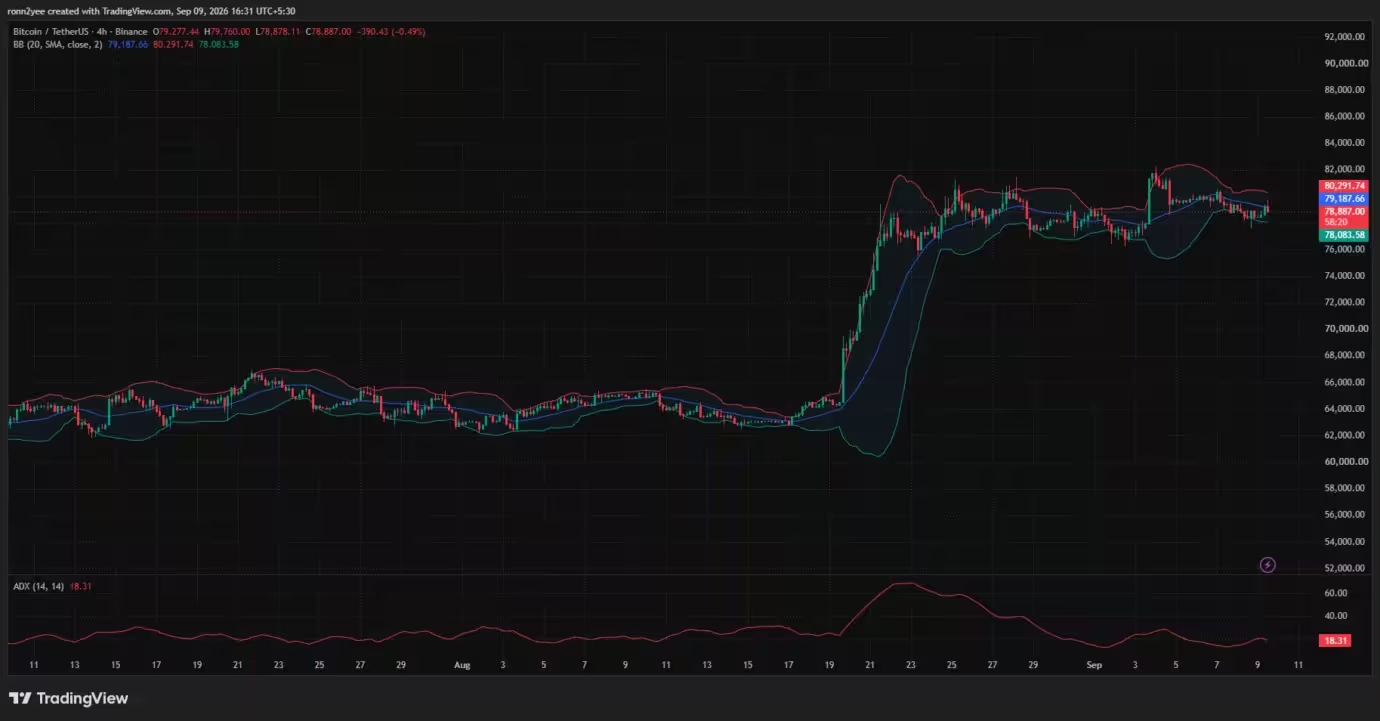
On the 4-hour chart, Bitcoin is trading below the Bollinger Band midpoint at about $79,187, which now functions as immediate resistance. Price has gravitated toward the lower half of the band range after failing to sustain support above the midpoint, and this dynamic raises the probability of range-bound action or sudden volatility near liquidity clusters.

Bitcoin price 4-hour chart — Sep. 9
The upper Bollinger Band is roughly $80,292 and the lower band sits near $78,084. A break below the lower band could expose the intraday low around $78,450, followed by the psychologically significant $78,000 level. Conversely, reclaiming $79,200 would be required for bulls before attempting a push toward $80,000 and the upper band.
The average directional index on the 4-hour timeframe reads about 18.31. ADX readings under 20 typically indicate an absence of a strong trend, implying the market may chop sideways until a decisive breakout occurs. Low trend strength does not indicate direction, but it leaves BTC vulnerable to abrupt moves when leveraged positions cluster around key prices.
Liquidity map highlights $77k and $80k as critical areas
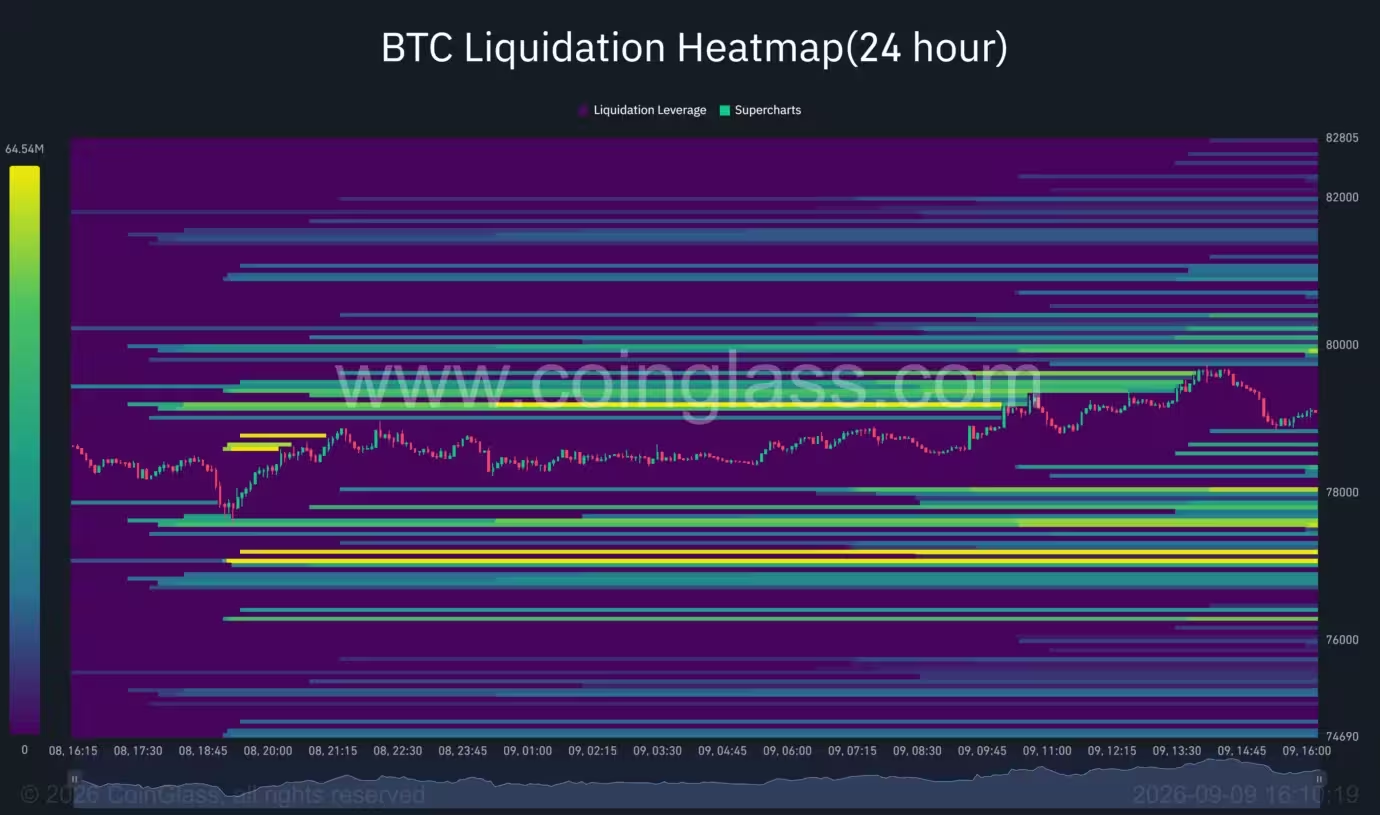
Derivatives positioning and liquidation risk will likely dictate short-term momentum. CoinGlass 24-hour liquidation data shows concentrated liquidity bands just above and below the current price. The nearest substantial band above market sits between roughly $79,200 and $80,000; a push into that zone could trigger short-covering and provide upward momentum toward $80,300.
Bitcoin liquidation chart
Additional liquidity pockets show up around $80,500 and the $81,500–$82,000 area, which explains why BTC struggled to hold gains above $82,000. On the downside, large liquidity clusters are visible near $78,000 and more intensely around $77,000. A sustained break below $78,000 would likely trigger long liquidations and could accelerate a slide toward the $77,000 band; if that fails, $76,300 becomes relevant as the next liquidity shelf.
Market commentators have described this setup as a tug of war, with leveraged positions concentrated above and below BTC. That configuration creates the conditions for a sharp cascade in either direction once a clear breakout appears.

What liquidation clusters mean for traders
High concentrations of stop-losses and derivatives orders create pathways for quick price moves. When price approaches these zones, liquidations can generate transient momentum that is disconnected from on-chain fundamentals. Traders should account for this by managing leverage, placing prudent stop levels, and monitoring open interest and funding rates across major derivatives platforms.
Bearish divergence raises the probability of a deeper correction
Several analysts have pointed out a bearish divergence between price action and the RSI. While price formed higher highs around the recent peaks, RSI showed lower highs, signaling weakening momentum beneath the surface. Bearish divergence is considered a warning sign that an advance may be losing traction, but it does not, on its own, guarantee a reversal.
According to the analyst Gerla, the bearish setup would be confirmed only after a clear break below channel support near $76,000. Conversely, a decisive move above $84,000 would invalidate the bearish thesis and suggest continued upside. Until one of those outcomes occurs, the path of least resistance will be shaped by how BTC handles the $78,000–$79,200 range.
Immediate scenarios for BTC
- Scenario 1, range-hold: If Bitcoin holds $78,000 and reclaiming $79,200 proves elusive, BTC may oscillate in the present $78k–$80.3k corridor while traders digest macro inputs and derivative flows.
- Scenario 2, bullish breakout: A successful reclaim of $79,200 followed by sustained buying could target the $80,000–$80,300 area and potentially retest the $82,000 region if momentum returns.
- Scenario 3, liquidity-driven selloff: A daily or extended 4-hour break below $78,000 raises the odds of a liquidation-driven drop toward $77,000 and possibly $76,000 if selling pressure persists.
Macro backdrop and derivatives risk
Macro drivers remain relevant for U.S.-based traders and global markets alike. Treasury yields and Federal Reserve policy expectations can shift demand for risk assets; higher yields may suppress appetite for growth-sensitive instruments, including crypto. Any unexpected change in rate guidance or economic data could prompt rapid repricing across derivatives markets, where BTC has dense positioning.
Given the concentration of leverage and the mixed technical picture, risk management is essential. Position sizing, reduced leverage, and clear stop-loss rules are prudent measures for traders navigating this environment.
Conclusion: watch the $78k–$80.3k battleground
Bitcoin remains above its longer-term moving averages, suggesting the larger recovery is still intact. However, short-term momentum indicators and concentrated liquidation bands make the current range precarious. The next confirmed break outside the $78,000–$80,300 corridor will likely determine whether BTC resumes its advance toward $82,000 or extends a correction toward $76,000. Traders should monitor RSI, ADX, Bollinger Band behavior, and liquidation heatmaps as they weigh directional probability and manage risk.


Leave a Comment
Comments (1)
is this even true? feels like leveraged squeezes could flip it any sec. 78k hold looks crucial, but 80k bands are sticky... funding and liquidations will decide