

Solana slides under $100 after two days of ETF redemptions
Solana (SOL) plunged below the $100 mark on October 29, pressured by consecutive net outflows from U.S. spot Solana exchange-traded funds (ETFs) and heightened selling from large holders. The token traded around $99.71 at the time of reporting, extending a difficult month that has seen SOL lose more than 15% of its value.
Key market figures
SOL price: $99.71 (reported) Monthly loss: 15.41% 24-hour change: -2.1% 7-day change: -4.74% Daily volume: ~$2.93 billion Market cap: ~$58.83 billion (ranking seventh by market cap) Circulating supply: ~589.98 million SOL Total supply: ~636.64 million SOL
ETF outflows: $24.82 million in two sessions
Data compiled by SoSoValue show combined net outflows of $24.82 million from spot SOL ETFs across two trading sessions (October 27–28). October 27 alone recorded $19.16 million in redemptions — the largest single-session withdrawal since December 3, 2025, when the funds lost $32.19 million. The next day added another $5.66 million in outflows.
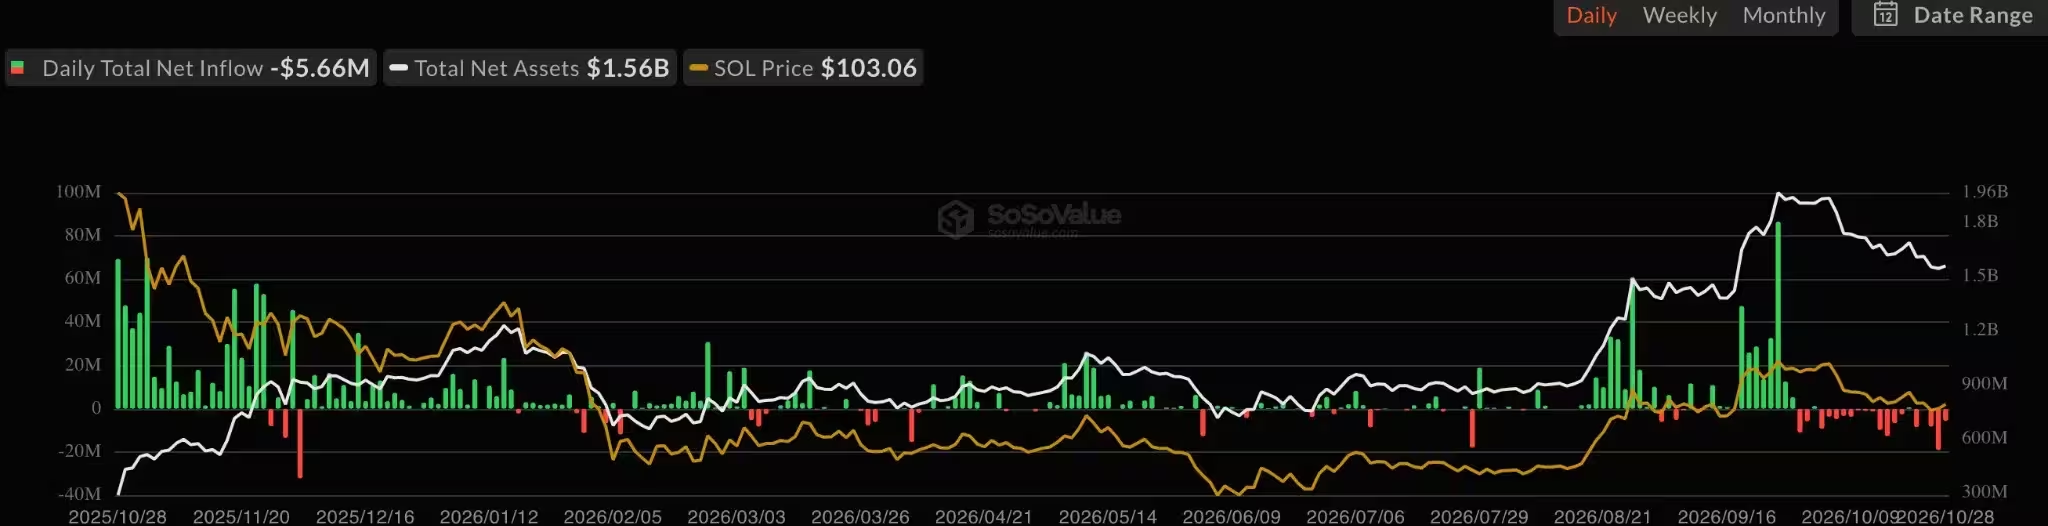
Solana spot ETF net inflow
Although aggregate ETF flows for October remain positive year-to-date (approximately $1.51 billion in net inflows), the recent withdrawals pushed reported October ETF redemptions above $105 million. ETF outflows are a clear short-term headwind for SOL price, but on their own they do not fully explain the entire decline; institutional selling and other market dynamics appear to be contributing factors.
What ETF redemptions mean for SOL
Spot ETF redemptions can force managers to sell underlying SOL holdings or unwind positions, adding selling pressure to the market. Because ETFs aggregate demand from multiple investors, large daily outflows are often correlated with notable price moves in the underlying crypto. Still, ETF data doesn’t give a complete picture of who is selling and whether off-exchange OTC trades or on-chain transfers are balancing demand.
Whale selling and on-chain activity
Blockchain analytics firm Lookonchain flagged a wallet that sold approximately 1.02 million SOL — roughly $104.3 million — over a five-day period. The wallet was linked to an entity tracked by Arkham, though identity and full execution details remain unverified. This sizeable disposition by a single large holder compounds the downward pressure caused by ETF outflows and market sentiment.
Meanwhile, on-chain adoption metrics show mixed signals: tokenized-equity holders on Solana reportedly reached about 1.5 million, up fivefold from August levels. That growth highlights expanding use cases for the network even as price action weakens.

Altcoin market weakness
Broader altcoin weakness has accompanied Solana’s decline. The CoinMarketCap Altcoin Season Index slipped 5.08% to 56, signaling softer performance across alternative cryptocurrencies and reinforcing the narrative that SOL’s slump is partly driven by wider market conditions rather than idiosyncratic issues alone.
Technical outlook: support, resistance, and possible scenarios
Technical indicators point to fragile near-term momentum for SOL. TradingView’s daily indicators showed SOL trading below the 20-day Bollinger Bands midpoint at $104.46, with the lower band close to $98.73. Indicators such as the Bollinger Band Power (-4.70) and the seven-day RSI (34.81) signal weak momentum, though they don’t guarantee further downside.
Crypto analyst CryptoBusy identified the $96–$100 band as critical support on the four-hour chart. If that region holds, buyers could attempt a rebound; but a confirmed move above $104–$105 would be required to challenge resistance between $108 and $112.
Potential near-term scenarios:
- Bearish: A daily close below the lower Bollinger band (~$98.73) could open doors toward $95 and $90, with a deeper drop to $80 as a more extended downside case.
- Neutral: Continued consolidation between $96 and $105 as buyers and sellers jockey for control, keeping volatility elevated.
- Bullish: A decisive breakout above $105–$110 would signal renewed momentum and could attract fresh inflows from traders and institutional participants.
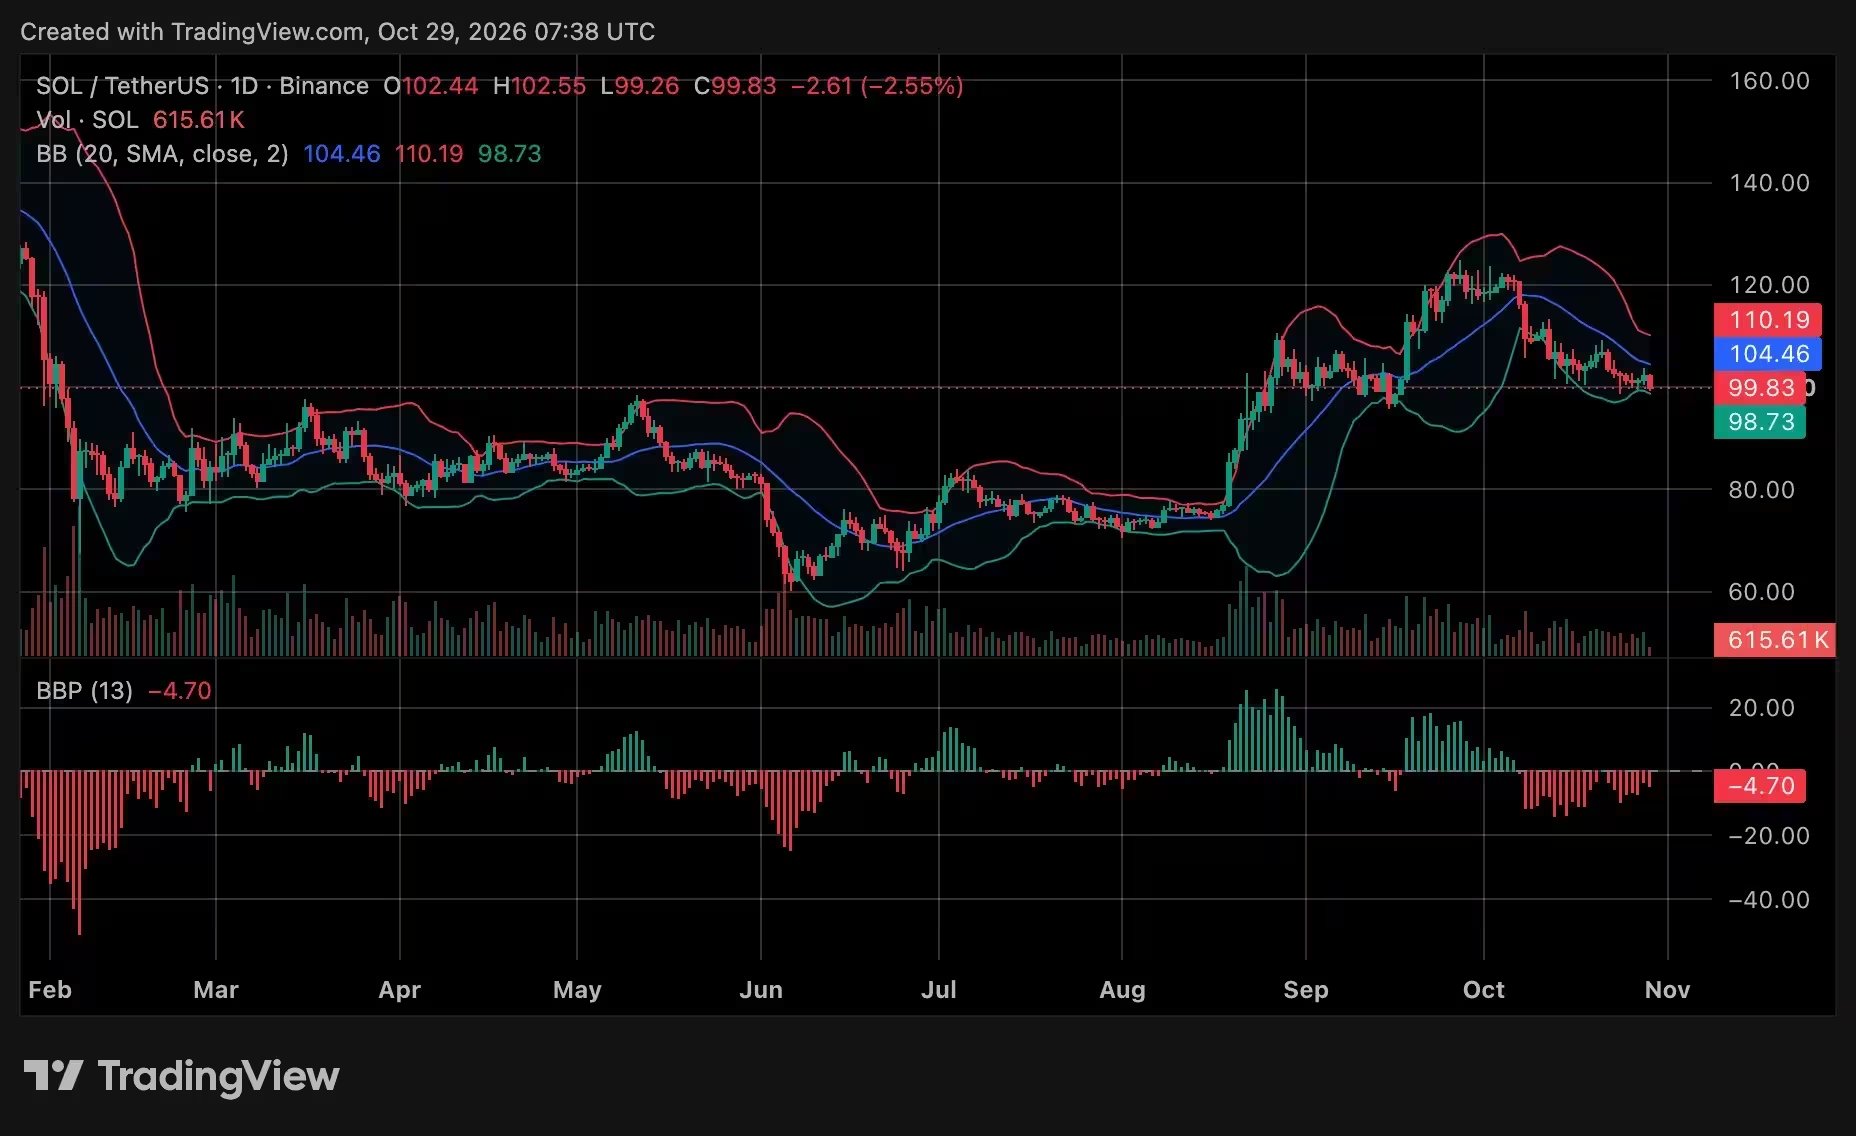
Solana price chart
Network upgrades and supply proposals: fundamentals still moving
Technical and governance developments on Solana continue even during the sell-off. The Alpenglow consensus upgrade activated on October 21, replacing the previous TowerBFT consensus mechanism and aiming to deliver substantially faster transaction finality — developers cite roughly 150-millisecond finality under the new design. Faster finality can improve user experience and decentralized finance (DeFi) throughput, supporting the network’s long-term utility.
Separately, proposals under SIMD-550 and SIMD-553 would alter issuance and fee-burning mechanics if implemented, potentially affecting how much SOL enters circulation and how much is permanently removed via transaction fees. Those supply-side changes remain proposals and will require community approval and real-world activity to demonstrate impact.
Why network upgrades matter amid price declines
Upgrades like Alpenglow emphasize Solana’s focus on performance and throughput — key competitive advantages in the Layer 1 space. Even if short-term price action is negative, technical improvements can bolster developer adoption, on-chain activity, and institutional interest over time. The growing count of tokenized-equity holders suggests demand for Solana-based products is rising, which could help stabilize demand for SOL if market conditions improve.
Takeaways for traders and investors
- Monitor ETF flows: Institutional inflows and outflows remain a leading indicator for SOL price pressure. Significant redemptions can exacerbate declines.
- Watch on-chain whale moves: Large wallet sales, like the Lookonchain-reported 1.02 million SOL unload, can create short-term liquidity shocks.
- Track technical levels: $96–$100 is a near-term support zone; a daily close below $98.73 would be bearish and could invite deeper selling.
- Focus on fundamentals: Network upgrades (Alpenglow) and proposals to change issuance/fee-burning (SIMD-550/553) are longer-term drivers that can affect supply/demand dynamics.

Solana’s immediate price path will likely be shaped by a mixture of ETF flows, large-holder behavior, and broader altcoin market sentiment. Investors should weigh on-chain fundamentals and network upgrades alongside short-term technical indicators when assessing risk and opportunity in SOL trading or investment strategies.

Leave a Comment
Comments
No comments yet. Be the first.