3 Minutes
Bitcoin consolidates near $105,000 as stablecoin liquidity grows
Bitcoin (BTC) is holding close to the $105,000 mark amid a steady buildup of stablecoin liquidity, suggesting a period of quiet accumulation that could precede the next significant breakout. Market participants are watching on-chain indicators and derivatives activity for signals that fresh buying power is waiting on the sidelines.
Key market snapshot
Bitcoin traded around $104,978 after a 1.3% dip over 24 hours. Price action in the past week has oscillated between $99,376 and $106,562, leaving BTC down only 0.4% over seven days and about 6% over the past month. The coin remains roughly 16% below its all-time-high of $126,080 on Oct. 6.
Despite a mild pullback, market participation remains robust. Daily spot volume rose roughly 12% to $70.68 billion, while derivatives volume climbed about 14.4% to $105.83 billion. Open interest dipped 3.34% to $67.58 billion, which points to position rotation rather than a fresh increase in net leverage — a sign traders are cautious ahead of potential volatility.
Stablecoin buildup signals latent buying power
On-chain analysis from CryptoQuant indicates that the Bitcoin Stablecoin Supply Ratio (SSR) has fallen to approximately 13.1 from above 18 earlier in the year — one of the lowest readings of 2025. A declining SSR typically means stablecoin reserves are growing faster than Bitcoin’s market capitalization, implying more dry powder is parked in USDC, USDT and other stablecoins ready to flow into BTC.
What the SSR decline suggests
The SSR falling from 15 to 13 over the past month, while BTC holds near $105K, suggests investors are not exiting the ecosystem but positioning to buy. Complementary CryptoQuant data shows on-exchange Bitcoin reserves decreasing at the same time Binance stablecoin balances are rising, a liquidity profile often seen near market turning points when long-term holders accumulate and selling pressure eases.
Technical overview: neutral momentum, room for a move
Technically, Bitcoin looks neutral-to-bullish. The Relative Strength Index (RSI) sits near 44 — not overbought or oversold — while the MACD remains slightly negative, pointing to modest short-term weakness rather than a full reversal. BTC finds reliable support around $99,000, a zone where buyers have repeatedly stepped in.
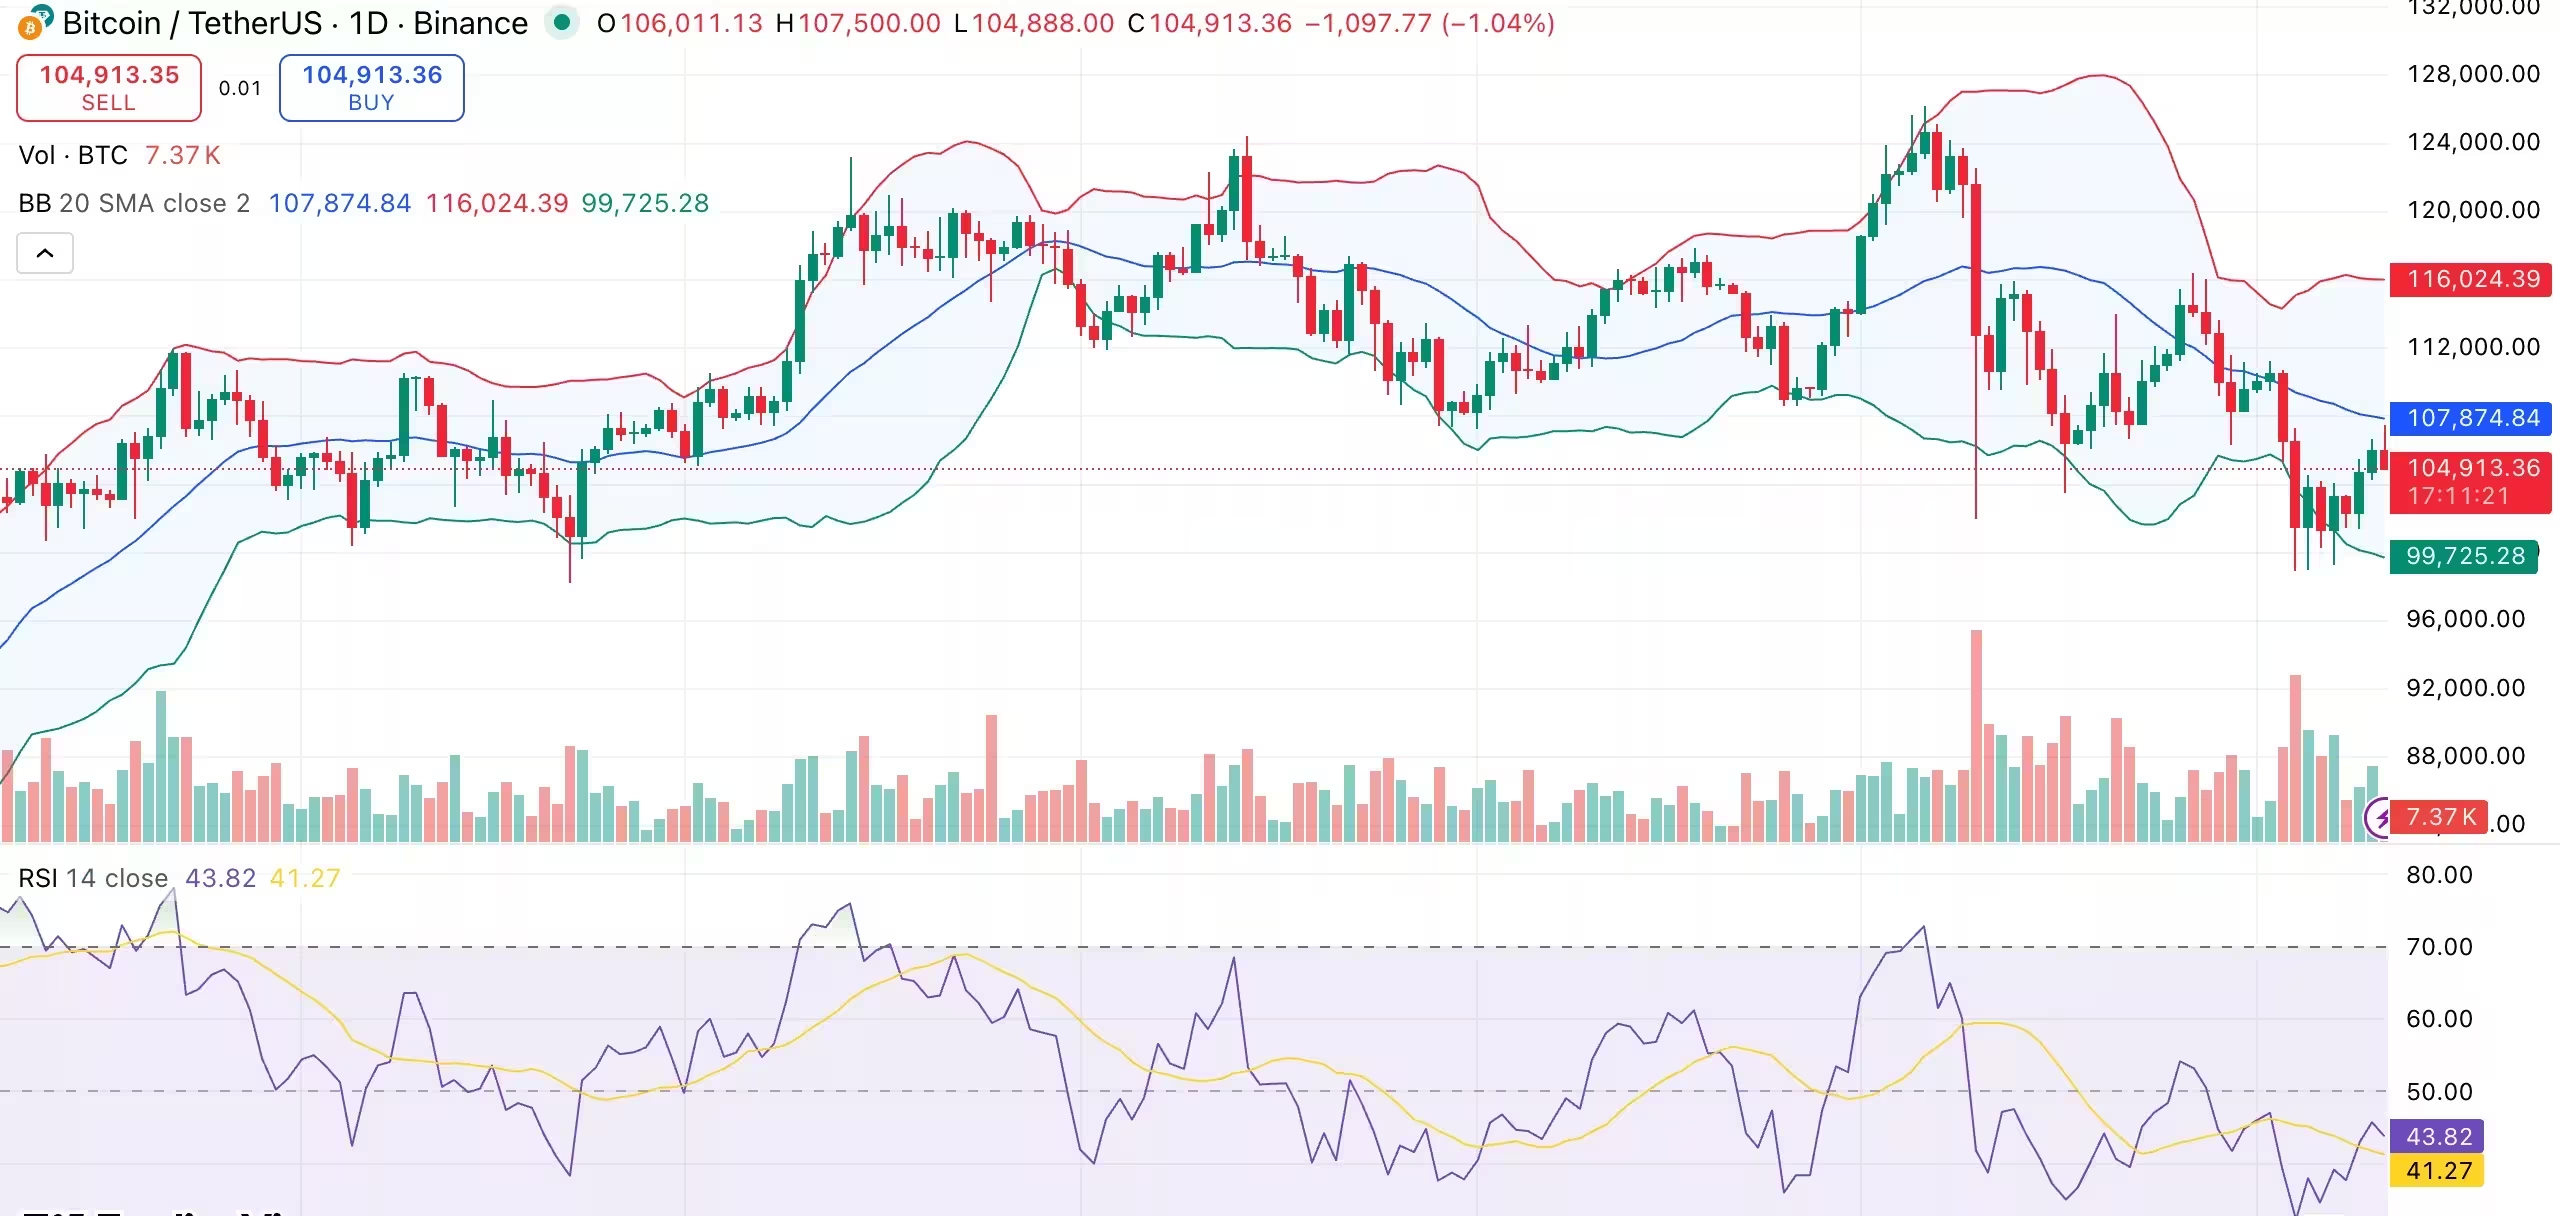
Bitcoin daily chart
Price is consolidating between short-term moving averages and the middle band of its Bollinger Bands, indicating a cooling-off after October’s volatility. A clear breakout above $107,800 could accelerate momentum toward the $112,000–$116,000 range. Conversely, a decisive break below $99,000 could open a retest near $97,000.
Outlook and trading considerations
Traders and investors should monitor stablecoin reserves, on-exchange BTC balances, derivatives volume and open interest for confirmation of accumulation. Rising stablecoin liquidity plus declining exchange reserves often precede bullish moves as buying pressure outpaces available sellers. Risk management remains essential: watch intraday liquidity and order-book depth if price approaches key resistance or support levels.
In summary, Bitcoin’s consolidation near $105K with growing stablecoin liquidity suggests latent buying power is building. While technical indicators remain cautious, the broader liquidity backdrop favors accumulation and positions BTC for a possible breakout if demand materializes.
Source: crypto
Leave a Comment