
3 Minutes
Solana stalls near $155 despite continued ETF inflows
Solana (SOL) has been trading in a narrow band around $155, even as Solana-focused ETFs continue to attract capital. crypto.news data shows SOL has lost ground on the weekly and monthly charts, down roughly 2.4% and 1.4%, respectively. The price action reflects broader market pessimism, with technical indicators pointing to limited bullish momentum for now.
ETF inflows show growing institutional interest
Data since Oct. 28 indicates a steady stream of capital into SOL exchange-traded funds. SoSovalue reports a 12-day inflow streak, with cumulative inflows over that period reaching $368.52 million. On Nov. 12 alone, SOL ETFs took in $18.06 million, led by Bitwise’s BSOL with $12.46 million and Grayscale’s GSOL adding $5.59 million. These figures underscore renewed institutional allocation to Solana-based exposure through regulated investment products.
Bitcoin and Ethereum see outflows amid rotation
While SOL ETFs are accumulating assets, Bitcoin and Ethereum products recorded meaningful withdrawals on the same day. BTC-tracking funds reported outflows totaling $277.98 million, and ETH ETFs posted $183.77 million in net redemptions. The divergence suggests a rotation of investor appetite, where some capital is shifting from BTC and ETH into alternative exposures like SOL ETFs.
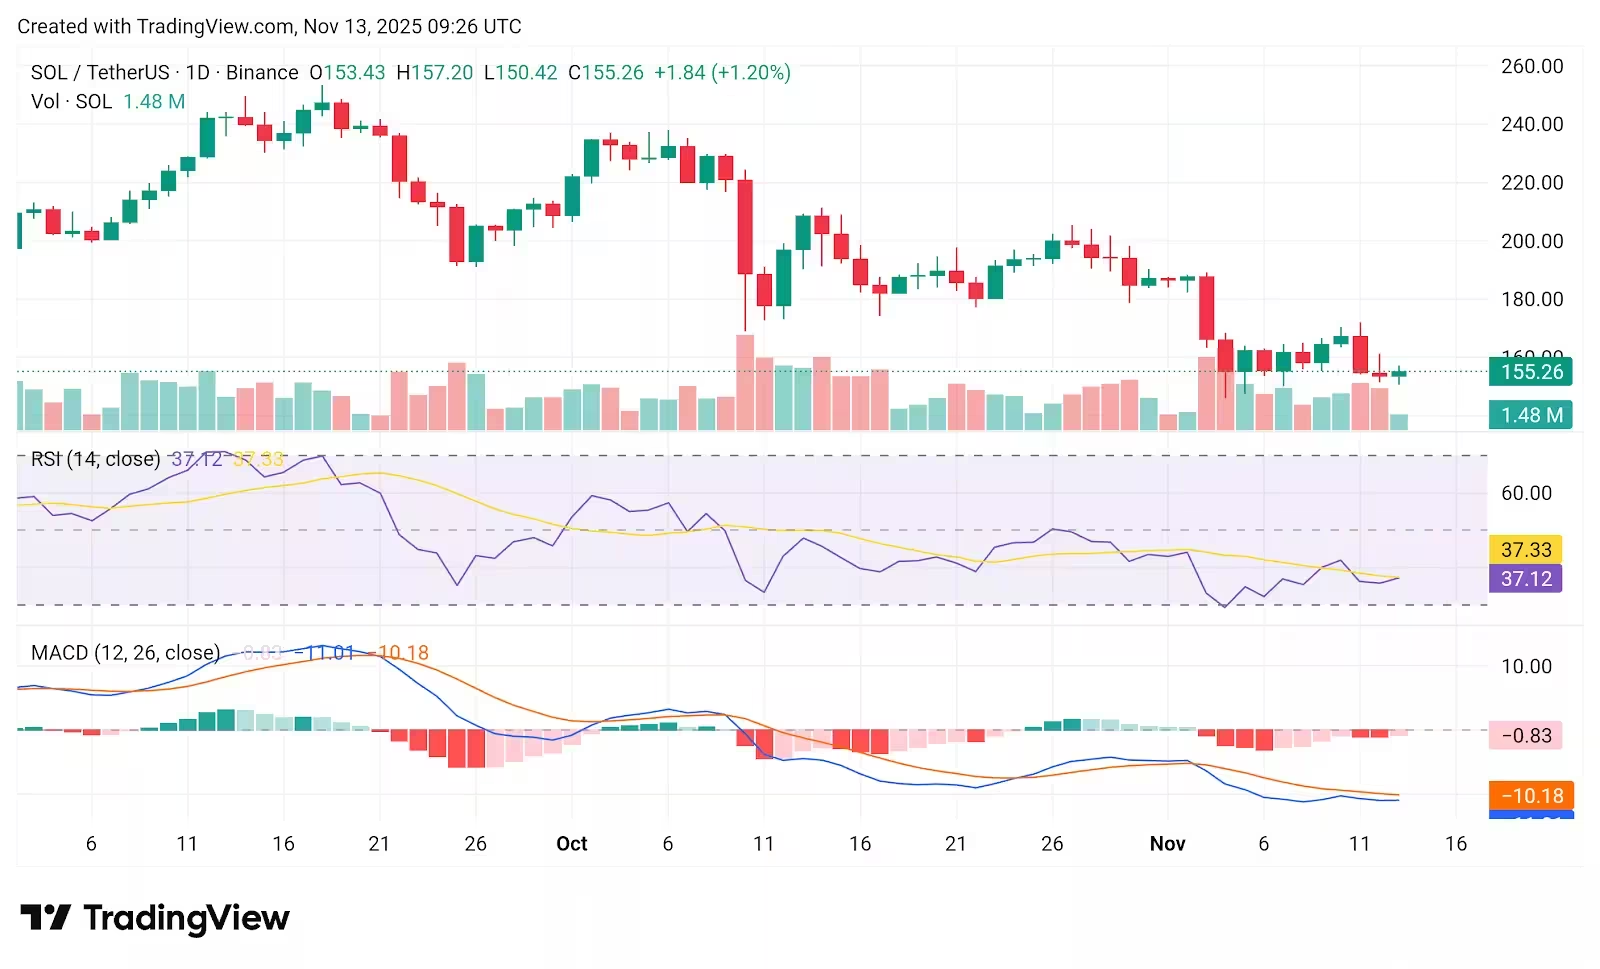
Solana price chart amid SOL ETF inflows
Technical picture: bearish indicators, key support and resistance
On the charts, SOL is consolidating between $150 and $162. Key technical indicators remain tilted toward bearish. The Relative Strength Index (RSI) sits near 37.12, well below the neutral 50 threshold and signaling weak momentum. MACD readings also remain negative, with the signal line below zero and histogram bars in the red. Together, these metrics imply limited conviction behind the recent inflows.
Immediate levels to watch
Short-term support is established at $150.42, a level that has held across the last three sessions. If that floor fails, downside risk could extend toward $142. On the upside, $162 is the immediate resistance; a decisive break above this zone — and a subsequent reclaiming of $173 — would be required to shift short-term sentiment toward bullish and validate the ETF-driven narrative.
What traders and investors should monitor
Investors should watch daily ETF flow data, on-chain fundamentals, and macro risk sentiment. Continued inflows into SOL ETFs could provide a base under price, but technical confirmation is necessary for a sustained uptrend. Keep an eye on RSI moving above 50 and MACD turning positive as early signs of a potential trend reversal.
Source: crypto
Leave a Comment