

5 Minutes
Ethereum price snapshot and context
Ethereum (ETH) was trading near $1,777 at the time of writing, up roughly 0.5% in the past 24 hours as markets absorb renewed ETF flows and mixed macro signals. Over the previous 24 hours ETH ranged from a low near $1,732 to a high of $1,820, with daily volume close to $17.1 billion — a sign that traders remain active after June's sharp sell-off.
Why $1,800 is the pivotal level
Analysts and traders have rallied around the $1,800 zone as the key short-term resistance. A decisive daily close above $1,800 is widely viewed as the trigger that could convert the recent bounce into a more sustained recovery. If ETH fails to overcome this barrier, the token risks remaining range-bound between roughly $1,700 and $1,900 for an extended period.
ETF inflows and macro drivers
Part of the renewed buying pressure has come from spot Ethereum ETF inflows. Weaker U.S. jobs data earlier in July and ongoing capital flows into crypto products helped drive a roughly 12% gain in ETH since July 1. According to SoSoValue, spot ETFs recorded a net inflow of about $29.082 million on July 6, with BlackRock's ETHA contributing roughly $29.742 million in single-day inflows.
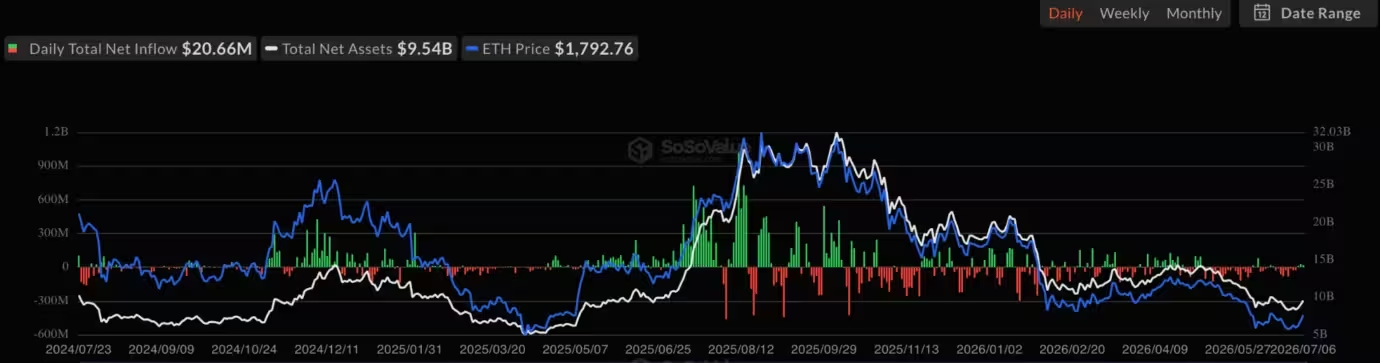
Ethereum Spot ETF Net Inflow
These inflows are a constructive technical tailwind, but they are not a guarantee of continued upside. Market depth, exchange reserves and trader behavior will determine whether spot demand can absorb fresh supply.
Technical indicators: what charts are signaling
Technical analysts point to a cluster of indicators near $1,796–$1,816 that together form the immediate resistance band. Ali Charts has highlighted the 0.8 MVRV Pricing Band at roughly $1,796 and noted that this level coincides with a TD Sequential resistance trendline. He argues that a daily close above ~$1,796 that then holds as support would strengthen the bullish thesis, while surpassing the TD risk line near $1,816 could open a path to channel resistance around $1,844.
Daan Crypto Trades echoed the view: a clean daily close above $1,800 would be the first meaningful sign of strength on the current timeframe.
On the downside, both analysts put the crucial support near $1,750. A decisive break below $1,750 would weaken the current setup and increase the likelihood of a re-test of the $1,700 area.
Momentum indicators: MACD and RSI
Momentum metrics currently support a short-term recovery, though they are not yet signaling a full trend reversal. The MACD histogram has moved into positive territory, indicating improving momentum, while the MACD line sits above its signal line but remains below zero — meaning buyers are gaining control, yet a stronger trend confirmation will need MACD to flip definitively into positive territory.

The 14-day RSI is trading around the mid-50s, above its moving average and above the neutral 50 mark. That places short-term momentum in buyers' favor without suggesting an overbought condition, so there is room for upside if demand continues.
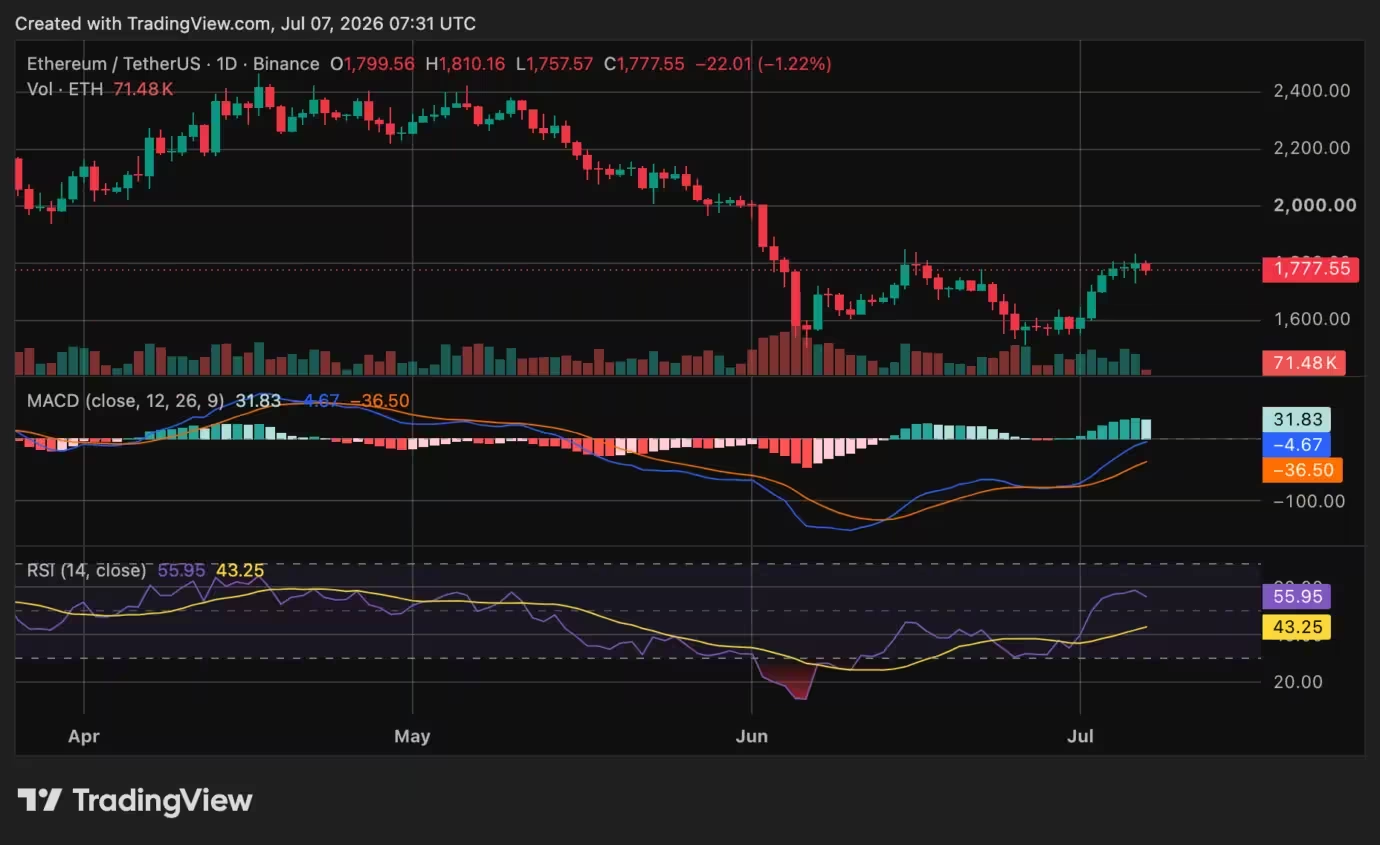
Ethereum (ETH) price chart
On-chain picture: liquidity, reserves and selling risk
On-chain metrics show a mixed outlook. CryptoQuant flagged a rise in Binance's 30-day exchange liquidity ratio to about 5.22, implying active turnover — roughly 20.32 million ETH in 30-day trading volume versus about 3.8 million ETH in Binance reserves. Higher turnover can support orderly price moves because exchange-held ETH is being traded rather than sitting idle.
However, rising exchange balances remain a potential headwind. Data compiled by market observers shows Binance holding around 3.893 million ETH, Bitfinex roughly 2.2 million ETH, OKX around 1.18 million ETH, and Bybit about 314,000 ETH. CryptoQuant analysts warn that additional ETH inflows into exchanges could translate into selling pressure if market demand does not absorb the extra supply.
Binance’s June proof-of-reserves snapshot also showed a roughly 10% increase in user ETH balances to about 4.14 million ETH. That uplift may reflect deposits, purchases or movements between accounts, but larger exchange balances generally raise the risk of future selling in a downside scenario.
Scenarios: targets and invalidation points
Bullish case: A confirmed daily close above $1,800 that holds as support could clear the way for tests at $1,844 and then higher targets such as $2,060 and a realized price zone near $2,245 if momentum and ETF demand persist. Analysts argue that moving past the TD risk line (~$1,816) would be an important intermediate confirmation.
Bearish case: Failure to close above $1,800 followed by a break below the $1,750 support would leave ETH vulnerable to a renewed range-bound period or a move back toward $1,700. Increased exchange reserves and any abrupt drops in ETF inflows or macro risk sentiment could accelerate downside pressure.
What traders should watch next
Key levels to monitor: $1,750 (support), $1,796–$1,816 (resistance cluster), $1,844 (channel resistance), and $2,060–$2,245 (extended bullish targets). Watch ETF inflow data, Binance and other exchange reserve changes, and daily closes around $1,800 — those items will likely dictate the next meaningful directional move for Ethereum.
Position sizing and risk management remain essential given the still-elevated volatility in crypto markets. Short-term technicals look constructive, but on-chain supply dynamics and macro catalysts can quickly change the setup.
Bottom line
Ethereum’s short-term setup has flipped toward bullish, but the $1,800 area remains the gatekeeper. A clean daily close above that zone — backed by continued ETF demand and muted exchange selling — could spark a stronger rally. Conversely, a failure to clear $1,800 or a break under $1,750 would keep ETH range-bound and expose it to further downside. Traders should watch momentum indicators, ETF flows and exchange reserves for the next decisive signals.














Leave a Comment
Comments (2)
Whoa MACD ticking up, kinda pumped but still cautious. If 1,800 holds we might test 2k quick, fingers crossed lol
Is ETF inflow really enough? Looks like exchange reserves could flip this fast. $1,800 hype but what if liquidity dries up...