

XRP retreats below a key short-term average
XRP price slipped beneath its 50-day moving average near $1.43 on Oct. 9, putting immediate upside momentum on the back foot and exposing lower support levels. CoinGecko recorded XRP near $1.39 after a seven-day decline of roughly 7.6%, with a weekly trading band between $1.32 and $1.53 and a market capitalization around $87.6 billion. While the token staged a modest 4.5% recovery over 24 hours, the technical backdrop suggests the rebound faces stiff resistance unless $1.43 is reclaimed.
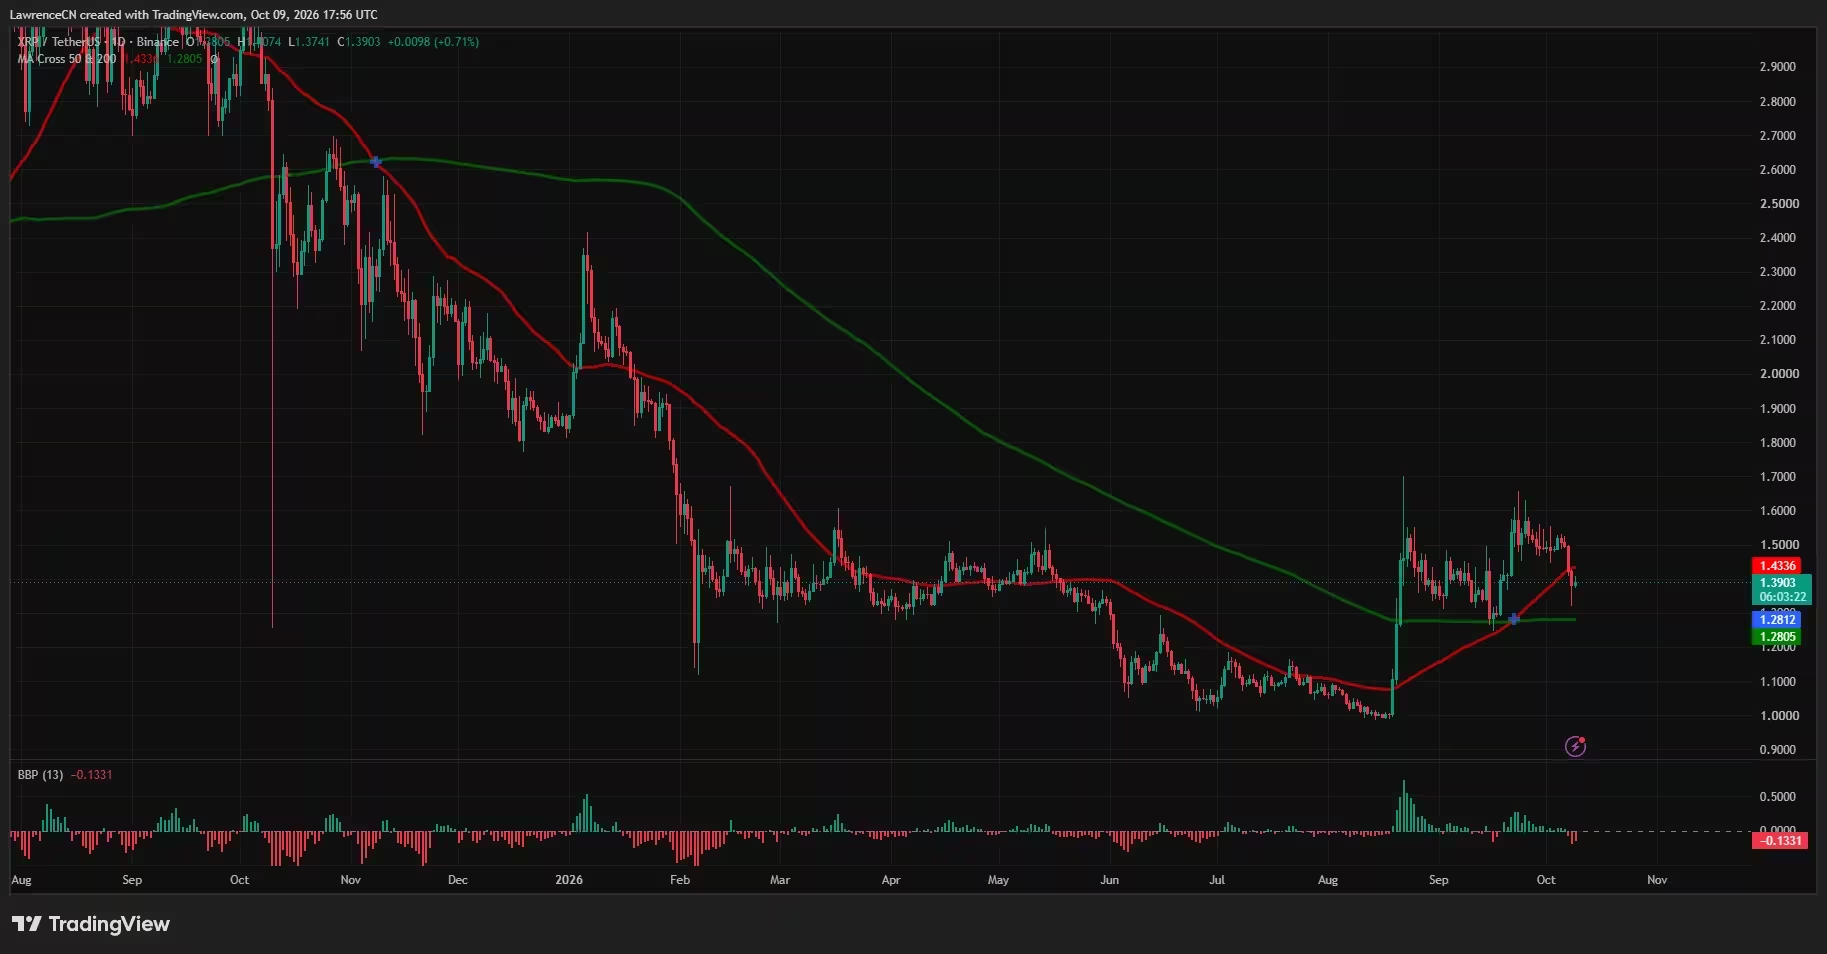
XRP price daily chart — Oct. 9
Daily technical picture: short-term momentum turned negative
Moving averages and immediate hurdles
The TradingView daily chart places the 50-day moving average at $1.4336 and the 200-day at $1.2805. After rallying in late September, the 50-day crossed above the 200-day, a bullish sign, but the recent sell-off pushed price back under the shorter average while keeping it above the longer-term trend reference. That leaves $1.43 as the first critical hurdle on any recovery attempt; clearing it would be a necessary step toward revisiting the $1.50–$1.53 zone.
Momentum indicators and downside references
Indicators show waning buying power. The daily Bull Bear Power reads negative at -0.1331, with red bars accompanying the decline beneath the 50-day average — a contrast with the stronger momentum seen in August. On the downside, the most immediate support from recent action is the weekly low near $1.32. A decisive break below $1.32 would put the daily 200-day moving average (~$1.28) squarely in focus, implying roughly an 8% downside from the current price.
Weekly chart: resistance and trend strength
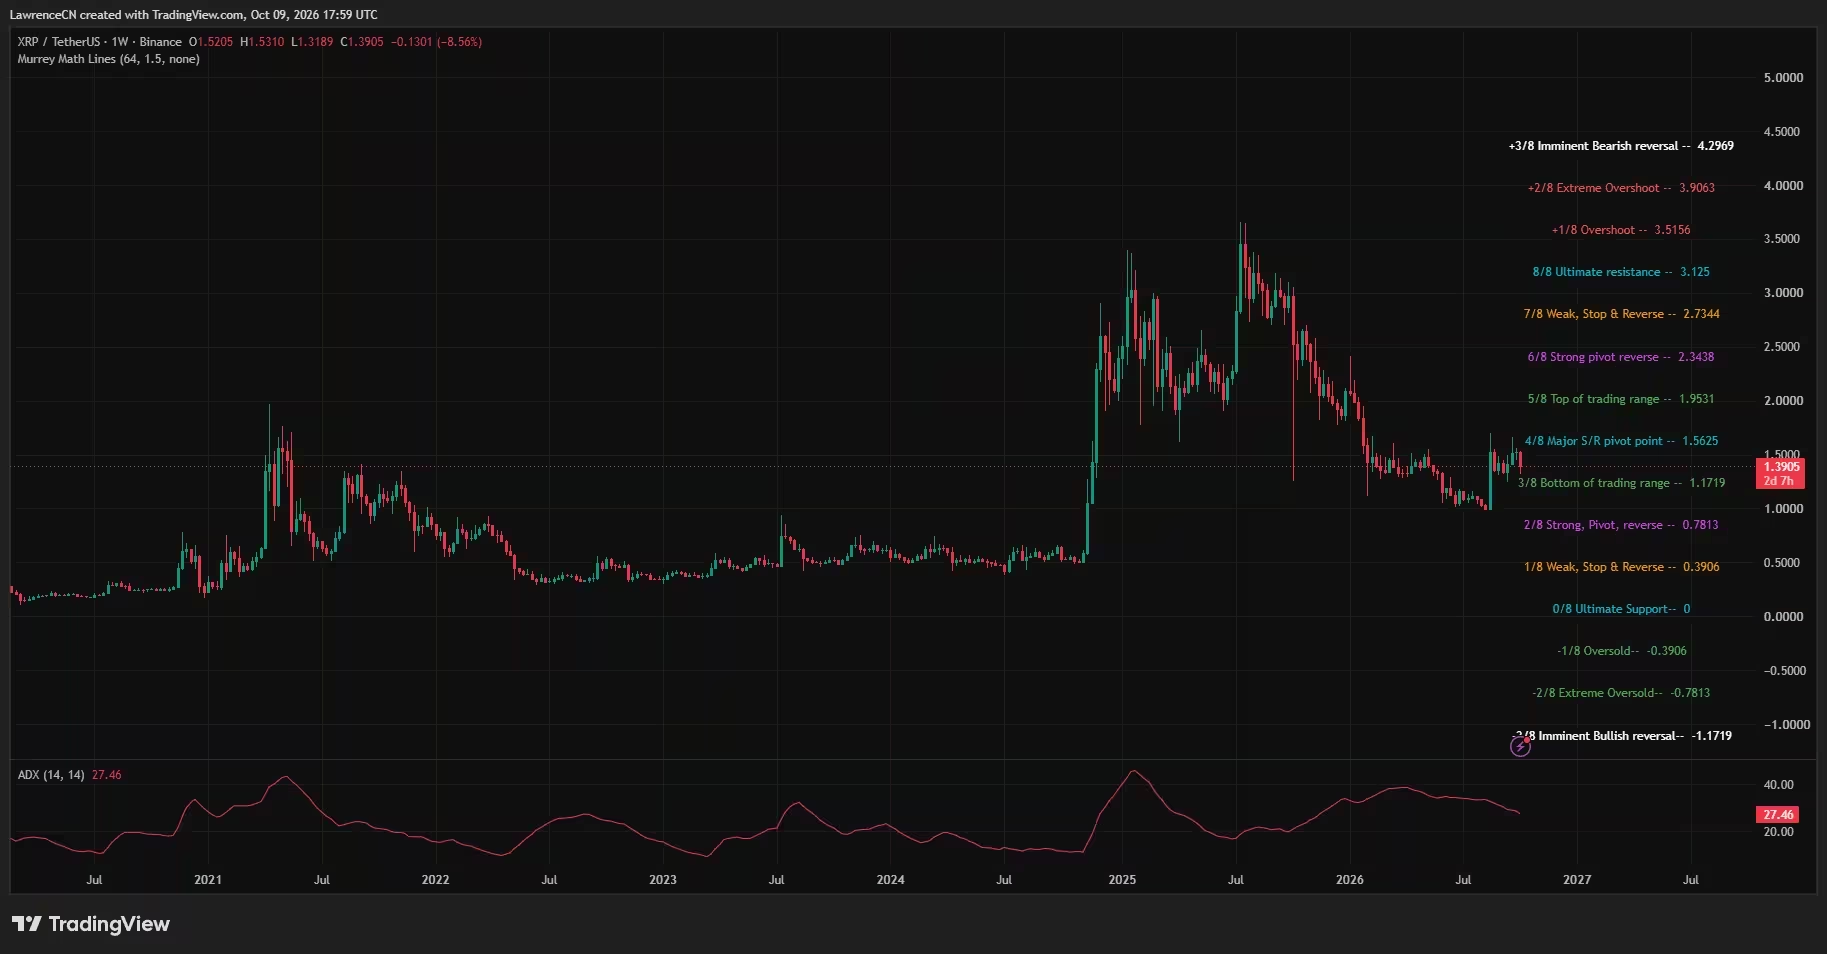
XRP price weekly chart — Oct. 9
On a weekly timeframe, XRP recorded a calendar-week drop of 8.56%, sliding from an open of $1.5205 to close near $1.3905, with a high at $1.5310 and a low at $1.3189. The weekly Murrey Math pivot identifies key resistance at $1.5625; XRP remains below that level, meaning the broader recovery lacks confirmation until that zone is breached. The Murrey Math bottom sits at $1.1719, which is a more distant downside target if downside pressure intensifies.
The weekly Average Directional Index (ADX) reads 27.46 and has eased from values above 30. ADX measures trend strength rather than direction, and the lower reading now indicates trending momentum has softened. For bulls, a clean reclaim of $1.43 followed by a push past $1.53 and the $1.5625 pivot would be required to reopen the path toward the late-September highs around $1.60–$1.65. Conversely, a drop below $1.32 would materially strengthen the bearish case.
Liquidation bands and leveraged exposure

XRP liquidation heatmap
CoinGlass liquidation data shows clusters of overhead liquidations in the $1.43–$1.44 and $1.53–$1.54 ranges, with the most persistent bright cluster around $1.53–$1.54. On the downside, concentrations appear near $1.36–$1.37 and around $1.35. The one-week heatmap illustrates a sharp move down from above $1.50 to roughly $1.32 late on Oct. 8, followed by a rebound that stalled below $1.41.
These liquidation bands matter because they identify where leveraged long positions may be vulnerable and where short-squeeze activity could occur. In the current setup, the $1.43 band aligns with the 50-day moving average and acts as the first significant supply zone for sellers and forced liquidations. Only after XRP clears those bands does the higher $1.53–$1.54 cluster become relevant for sustained upside.
Fundamental catalysts: Evernorth listing, XRPN and ledger updates
Market-driven technicals are being traded alongside several important fundamental events. Evernorth delayed the planned Nasdaq listing of XRPN from Oct. 8 to Oct. 12, citing an administrative delay and customary closing conditions. Evernorth expects to hold about 473 million XRP at closing — a sizeable treasury that would be accessible to U.S. stock-market investors should the Nasdaq listing proceed. This listing remains a scheduled catalyst and could influence investor flows into XRP-related instruments.
Separately, the XRP Ledger released an emergency security patch (version 3.4.1) and scheduled an associated amendment for Oct. 9, contingent on validator support. The release cautioned operators that outdated servers could lose synchronization after activation; the security-sensitive source code was to be published thereafter. Such network-level updates can create short-term operational risk and heightened market attention.
On the institutional front, Ripple announced that Ripple Prime will offer brokerage, clearing and financing services to Brevan Howard funds, a move tied to approximately $35 billion in assets. That partnership highlights growing institutional activity around XRP and related custody, trading and financing services.
What traders and investors should watch
Key price levels to monitor:
- Immediate resistance: $1.43 (50-day MA and liquidation cluster)
- Near-term bullish targets: $1.50–$1.53, then $1.56 (Murrey Math pivot)
- Immediate support: $1.32 (recent weekly low)
- Longer-term support: $1.28 (200-day MA)
Risk management is essential given the concentrated liquidation bands. Short-term traders should be mindful of forced liquidations around $1.35–$1.37 on the downside and overhead liquidations near $1.53–$1.54 that could both exacerbate intraday volatility. Fundamental catalysts, including the Evernorth XRPN listing and XRP Ledger upgrades, add event risk that can swing sentiment quickly.
Conclusion: reclaim $1.43 to restore bullish momentum
Technically, XRP needs to retake $1.43 to reassert a path toward the $1.50–$1.56 area. Failing that, a fresh break below $1.32 would make the daily 200-day average (~$1.28) the next logical downside target. With liquidation heatmaps and pending fundamental events in play, both traders and longer-term investors should prioritize disciplined entry and exit levels and stay alert for rapid shifts in leverage-driven price action.

Overall, XRP’s immediate test is clear: reclaim the 50-day average to regain momentum, or risk sliding toward the longer-term average and lower support zones as market participants digest upcoming corporate and protocol developments.

Leave a Comment
Comments (1)
is 1.43 really the make-or-break? Feels like leverage bands just blow up small moves, not real fundamentals. if XRPN listing delays hit, could be a mess... hmm