

Market snapshot: BTC rebounds after easing Iran tensions
Bitcoin price climbed back above $82,000 on Friday, October 9, after U.S. President Donald Trump publicly ruled out pre-midterm military strikes against Iran. The statement removed some of the immediate geopolitical risk that had pushed BTC toward intraday lows near $80,300, allowing cryptocurrencies to regain lost ground.
Key data points
According to CoinGecko, Bitcoin (BTC) was trading near $82,365 at the latest check, with a 24-hour volume of around $40.43 billion and a market capitalization of roughly $1.65 trillion. Despite the rebound, BTC remained about 5% lower over the past seven days as selling pressure and ETF outflows weighed on the market.
Why Trump’s announcement mattered for crypto
President Trump wrote on Truth Social on October 8 that "We will not be attacking Iran at any time prior to the Midterm Elections to be held in the United States on November 3rd." He described recent discussions with Iranian officials as "productive" while indicating that existing sanctions and blockades would stay in place.
Markets had responded earlier in the week to reports that the Pentagon might be preparing for renewed operations against Iran. Those reports lifted crude oil futures and increased risk aversion in broader financial markets, pressuring risk assets including Bitcoin. Once the president explicitly ruled out new attacks before the midterms, crude prices retreated and BTC found buying interest near prior support levels.
The pullback in energy prices was notable: WTI futures fell back from intraday highs around $93.20 to about $90.40, while Brent eased toward $102.91. Lower oil risk helped relieve some market-wide stress that had exacerbated Bitcoin selling.
ETF flows and profit-taking remain headwinds
U.S. spot Bitcoin ETFs continued to see net outflows amid the recent weakness. SoSoValue data for October 8 indicated roughly $244 million left spot Bitcoin ETFs, extending a short streak of withdrawals.
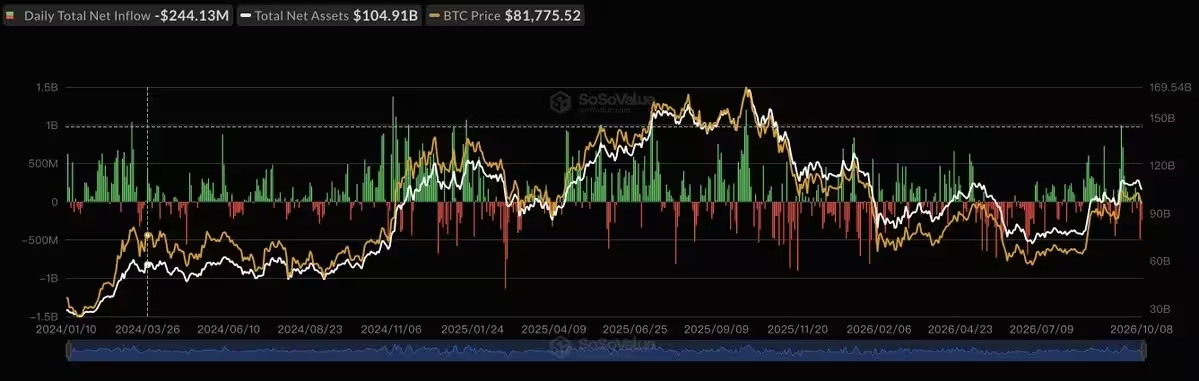

U.S. spot Bitcoin ETFs net inflow
That followed a much larger $484.9 million outflow on October 7 — the largest single-day withdrawal since June — with BlackRock’s IBIT, Fidelity, and other ETFs accounting for a significant portion of the redemptions. Among major funds, Franklin Templeton’s Franklin Bitcoin ETF (EZBC) appeared to be the only product recording a net inflow that day.
Spot Ether investment products also experienced pressure, with spot Ether ETFs reportedly seeing $72.54 million in net withdrawals on October 8, extending their losing streak to eight trading sessions.
Beyond ETF flows, on-chain analytics revealed significant profit-taking. Santiment reported that Bitcoin holders realized about $1.03 billion in profits on the latest reading — the second-highest single-day realized profit metric of 2026 and close to the year’s peak near $1.04 billion. Santiment’s realized profit compares on-chain coin movement values to prior movement values and is a commonly used measure of investor profit-taking behavior.
Why these outflows matter
Institutional flows — especially those into and out of U.S. spot Bitcoin ETFs — have been a major driver of price momentum since ETF approvals increased long-term demand expectations. Large daily outflows can strain price support by removing a layer of buyer demand and forcing some funds to liquidate holdings or rebalance, which in turn can pressure spot markets.
Technical picture: $82,500 the critical weekly pivot
Analysts remain focused on the $82,500 area as a decisive weekly support level for Bitcoin. Several market observers, including Rekt Capital, noted that BTC has struggled to reclaim and hold the upper range that once sat between roughly $82,500 and $86,700.
If BTC can close above $82,500 on a weekly basis, that would be a constructive sign that the trading range has been preserved as support. Conversely, a weekly close below that mark could expose Bitcoin to further selling and a potential retest from the underside.
Crypto analyst Colin Talks Crypto has highlighted a double-top formation around the $87,000 area after repeated failures to sustain rallies there. While a double top can signal a local topping pattern followed by a breakdown, Colin emphasized that such formations do not always lead to a new cycle low — they can precede corrective phases that establish higher lows ahead of a renewed recovery attempt.
Bollinger Bands, RSI and short-term resistance

Daily technical indicators paint a mixed picture. BTC traded near $82,402 after an intraday high of about $82,536, and remained below the middle Bollinger Band at $84,281 — the immediate midpoint resistance. The lower Bollinger Band near $81,410 currently marks the nearest technical support.
A sustained move above the middle band at $84,281 would shift momentum more favorably and put the upper band near $87,151 in focus as the next resistance zone. Short-term resistance levels to watch include $82,566 and $83,468; a daily close above $83,468 would open the path toward roughly $84,432.
On the downside, the $80,328–$81,684 area protects immediate support, covering Monday’s low and recent close levels. A daily close below $80,328 could target the 79,600–80,000 area and then the September 18 region near $76,200–77,000.
The Relative Strength Index (RSI) sat around 49.65, slightly below its moving average of 60.73 and just under the neutral 50 threshold. The reading suggests that buying momentum is weakened after BTC failed to sustain levels near $87,000, but it remains far from oversold territory (below 30), leaving room for both further consolidation or renewed upside if catalysts re-emerge.
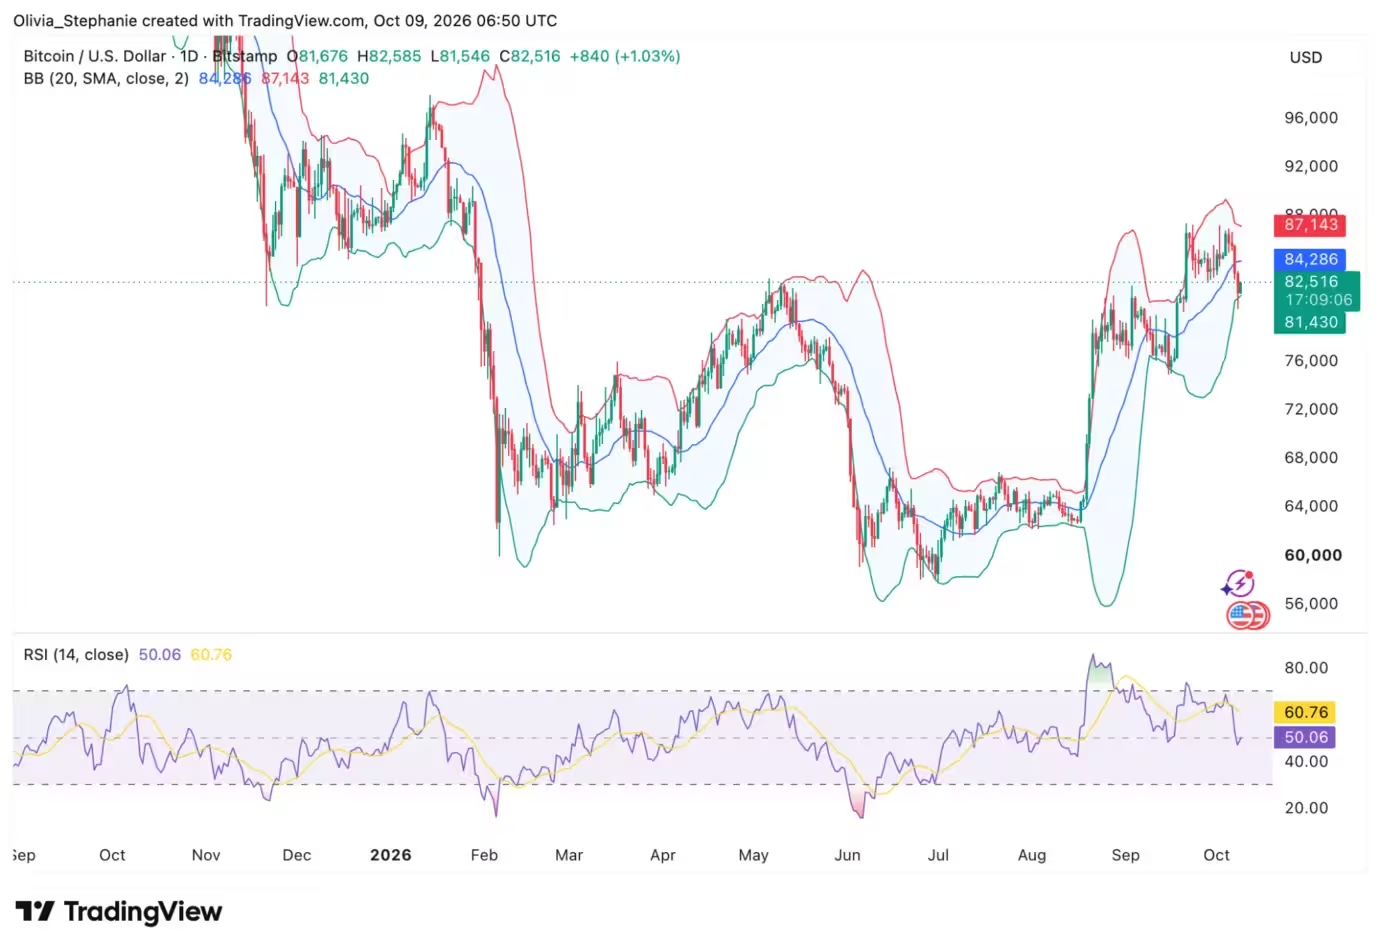
Bitcoin (BTC) price chart
Macro and on-chain drivers to monitor
Several factors will likely influence Bitcoin’s near-term trajectory:
- ETF flows: Continued net outflows from U.S. spot Bitcoin ETFs would remain a dominant bearish pressure. Conversely, a resumption of inflows could quickly restore upside momentum.
- Geopolitics and macro risk: Developments around Iran or other geopolitical flashpoints can trigger rapid risk-off moves that hit BTC, so traders will monitor headlines closely.
- Realized profits and on-chain behavior: Elevated realized profits, as measured by Santiment, can indicate near-term distribution and potential consolidation. Monitoring supply on exchanges and large wallet movements will be important.
- Technical confirmations: Daily and weekly closes relative to $82,500 and the $84,281 midpoint will help determine whether the market resumes a bullish trend or slips into deeper consolidation.
What traders and investors should watch
Short-term traders should watch intraday support at $81,410 and nearby resistance at $84,281. For longer-term investors, weekly closes and cumulative ETF flows will be important signals for whether institutional demand is reasserting itself.
Risk management remains critical. Given the recent volatility and the potential for headline-driven moves, investors should consider position sizing, stop-loss placement, and the possibility of rapid liquidity-driven swings.

Conclusion: Recovery fragile but not insignificant
Bitcoin’s rebound above $82,000 following the U.S. president’s comments about Iran provided relief to markets and coincided with an easing in oil prices. Yet ETF outflows and significant realized profits indicate that distribution pressures remain in play. The $82,500 weekly support and a daily recovery above $84,281 will be important technical confirmations for bullish momentum. Until those levels are decisively reclaimed, market participants should expect continued volatility and closely monitor ETF flows, on-chain metrics, and macro headlines that can shift investor sentiment quickly.

Leave a Comment
Comments
No comments yet. Be the first.