

Top 200 crypto assets show limited gains despite major tokenomics shifts
The market-cap weighted Top 200 crypto assets have risen only about 5% since October 2021, even as annual new token supply growth has slowed dramatically from roughly 26.5% to 3.3%. Crypto market analyst Jamie Coutts’ analysis places the Top 200 about 35% below a long-term growth trend that has averaged roughly 35% per year since 2017. His work highlights how token issuance and how projects return value to holders have transformed over the last five years — but price performance has barely budged.
Summary of the key findings
- Top 200 crypto assets are up only ~5% since October 2021 but remain about 35% under a long-run trend.
- Annual new token supply growth fell from 26.5% to 3.3% while payouts to token holders increased roughly fivefold.
- Crypto projects spent about $638 million on token buybacks through August 2026, versus $545 million for all of 2025.
- Altcoin market cap has climbed about 45% since June; 87% of Binance-listed altcoins traded above their 200-day moving averages by late September.
- U.S. spot Bitcoin ETFs continue to attract larger inflows than most other crypto funds; flows into Ether and Solana products slowed after a strong September.
How supply dynamics have changed
Coutts’ analysis, based on Bitformance’s market-cap weighted Top 200 with daily data back to April 2017, uses a log-linear trend line to illustrate the market’s long-run path. The current 35% gap indicates how far market value sits below that historical trajectory — a gap the chart’s creator explicitly notes is not a forecast.
For years, token issuance from emissions, vesting schedules for investors, and team allocations put steady pressure on tokenholders. As Coutts puts it, “Supply ate the demand,” a reference to how persistent dilution countered growing adoption and network usage.
Since that period of heavy issuance, however, tokenomics appear to be shifting. New supply growth has dropped to roughly 3.3% annually from 26.5% at peak issuance. At the same time, payouts to token holders — via burns, buybacks, fees distributions and reduced emissions — have increased materially, rising about fivefold according to the same analysis. Coutts describes this transition as a nascent “payback era” in crypto.
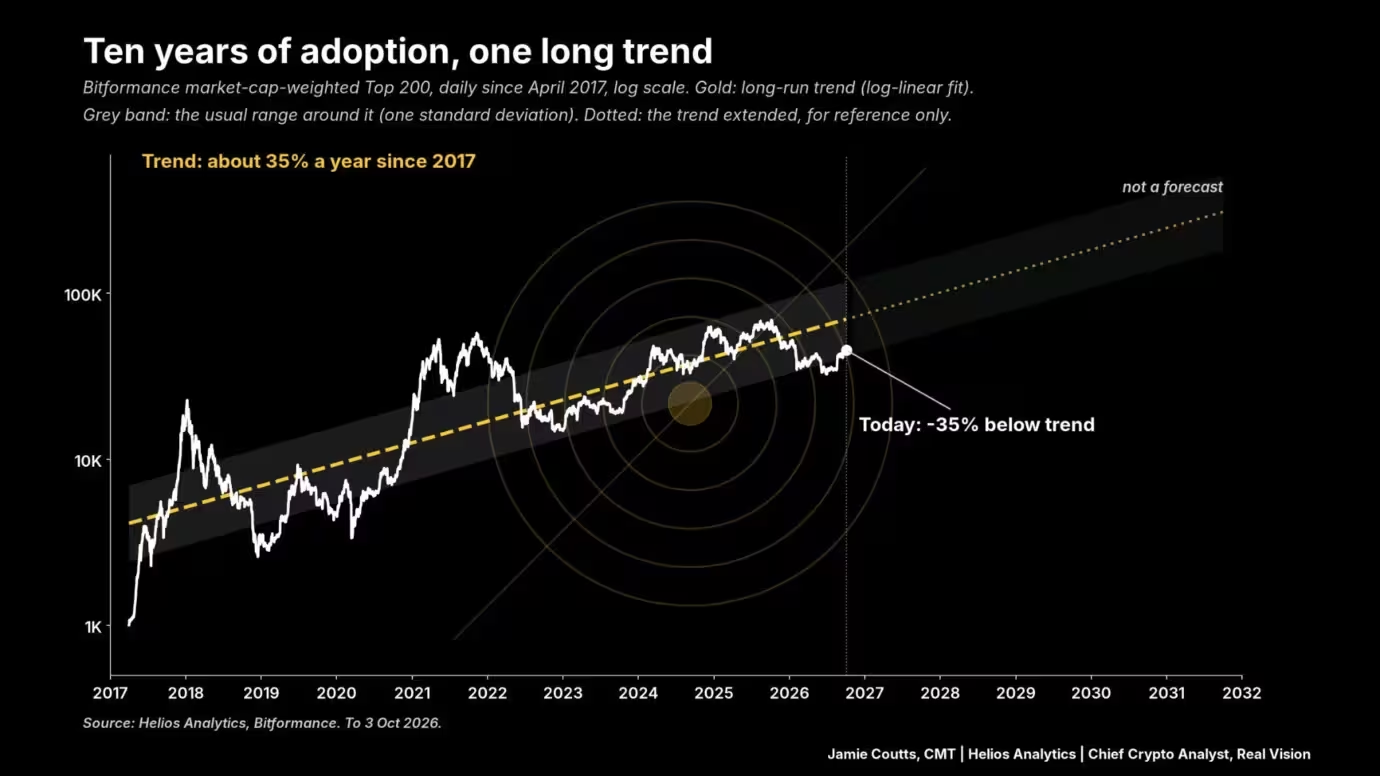
Crypto adoption trend.
Which tokenomic changes are becoming more common?
Looking across tokens that entered the Top 100 at least once since 2021 (309 projects in total), Coutts found an increase in tokenomics changes that benefit holders. Favorable adjustments — token burns, buybacks, protocol fee distributions and emission cuts — rose from around 10 such changes in 2021–2022 to 32 today. These moves reduce net issuance or redirect protocol revenue to repurchase and remove supply from markets, improving the supply side of the demand-supply equation.
Buybacks and revenue-directed repurchases: growing but concentrated
Protocol-funded buybacks have scaled up, though the distribution of those purchases is highly concentrated. Allium Labs data, cited by the Financial Times and reported previously, shows roughly $638 million in tracked token buybacks between January 1, 2026 and Aug. 31, 2026. By comparison, the full year 2025 saw about $545 million in buybacks and 2024 totalled only $366,000 in recorded purchases.
Two projects — Hyperliquid and Pump.fun — accounted for nearly 90% of the 2026 total. Hyperliquid channels eligible trading fees into HYPE purchases via an Assistance Fund; Pump.fun uses revenue from its product suite to repurchase PUMP tokens. Other protocols are exploring similar mechanisms: Jito has proposed dedicating 100% of its JTX revenue share to JTO buybacks and burns through at least Q4 2027, while BitTorrent introduced a program in July allocating revenue from decentralized services to quarterly BTT purchases and permanent burns.
Despite growing repurchase programs, token unlocks and weaker demand can still offset buyback effects. The ultimate impact depends on the scale of buybacks, available protocol revenue and whether tokens are permanently burned or retained in treasuries.
Altcoin breadth improves, but uneven gains persist
Demand across altcoins has recovered from mid-year lows, though performance is uneven. By Sept. 27 Total2 (altcoin market capitalization) had increased by more than $371 billion since June, reaching roughly $1.17 trillion. CryptoQuant data showed 87% of Binance-listed altcoins trading above their 200-day moving averages by late September, a notable reversal from the end of June when 84% of those coins were below that threshold.
Altcoin market capitalization rose about 45% over the June-to-September period. Aggregate open interest in altcoin perpetual futures even surpassed Bitcoin open interest in early September for the first time since December 2024, while market cap outside the 10 largest crypto assets climbed above $200 billion. Still, Coutts’ Top 200 index — which spans the 2021 peak, the 2022 drawdown and the subsequent recovery — is only about 5% above its October 2021 level.
Bitcoin dominance and ETF flows remain a key story
Bitcoin continues to command a substantial share of market value. On Oct. 5 total crypto capitalization was roughly $2.98 trillion and Bitcoin dominance hovered near 57%. CryptoQuant also found that apparent Bitcoin demand improved by around 81,000 BTC between Sept. 24 and Oct. 1, though the demand signal stayed negative overall.
U.S. spot Bitcoin ETFs remain the primary destination for institutional inflows. From Sept. 21–25, spot Bitcoin ETFs took in about $2.39 billion, while Ether ETFs attracted $689.8 million and Solana funds $188.1 million. In the following week (provisional Sept. 28–Oct. 2 figures), flows slowed: BTC products saw $82.9 million, Ether ETFs recorded $118 million in net outflows, Solana inflows dropped to $800,000 and Hyperliquid-managed funds received $3.4 million.
Those figures illustrate uneven investor appetite across crypto investment products at a time when supply-side dilution is receding. Reduced issuance lowers fresh selling pressure, but sustainable price recovery also depends on meaningful, persistent demand.
What to watch next
Key variables to monitor include continued tokenomic adjustments (more burns, fee distributions and buybacks), the trajectory of token unlock schedules, ETF inflows across multiple assets, and whether retail and institutional demand can expand enough to close the 35% gap to the long-run trend. If supply remains restrained and demand strengthens — especially beyond Bitcoin — the market may begin to reflect the improvements already underway in tokenomics and protocol revenue models.
For investors and observers, the mix of lower net issuance, concentrated buybacks and evolving ETF flows creates a complex but potentially constructive backdrop for select altcoins and projects with sustainable revenue or clear token utility. As Coutts points out, the era of heavy dilution may be giving way to a period where networks actually pay holders back — but confirmation will require consistent demand to match the supply improvements.


Leave a Comment
Comments (1)
Wait so supply growth collapsed from 26% to 3% and price only +5% since 2021? Sounds off, or demand just missing.. whats missing here?